Mickey Rafa
  • Home
  • Portfolio
  • Workshops
  • Visualizations
Categories
All (20)
api (8)
cdcplaces (2)
cluster-analysis (4)
data-viz (13)
duckdb (1)
environment (4)
generative-AI (1)
gganimate (1)
gt (2)
international-development (4)
javascript (1)
Javascript (3)
mapping (7)
matplotlib (1)
pandas (1)
pca (1)
plotnine (1)
purrr (2)
Python (2)
Quarto (6)
R (16)
regression (3)
sports (1)
sql (1)
SQL (2)
tidycensus (4)
tidyverse (13)
web-scraping (1)

My Portfolio

Creating great U.S. county maps with advanced ggplot styling
R
data-viz
mapping
tidyverse
cdcplaces
api

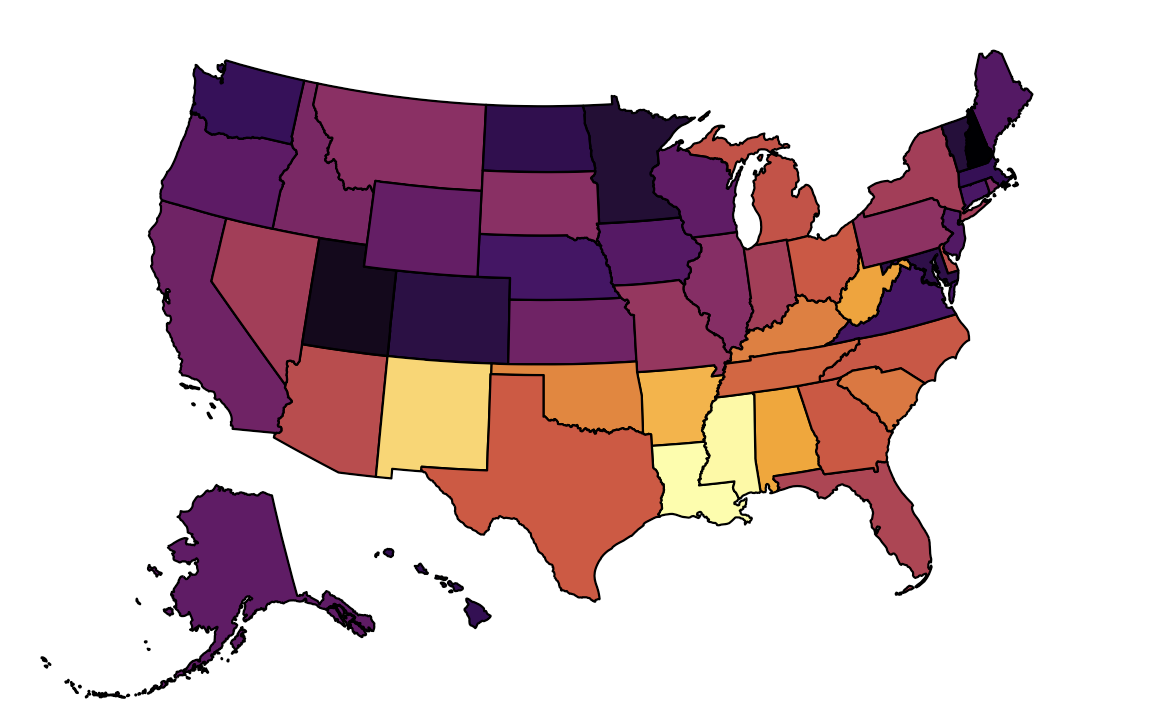
This post shows how to make a beautiful U.S. map and create your own ggplot theme

Mickey Rafa
Oct 1, 2024

Mapping depression and food insecurity in the U.S. with the CDC PLACES project
R
data-viz
mapping
tidyverse
cdcplaces
api

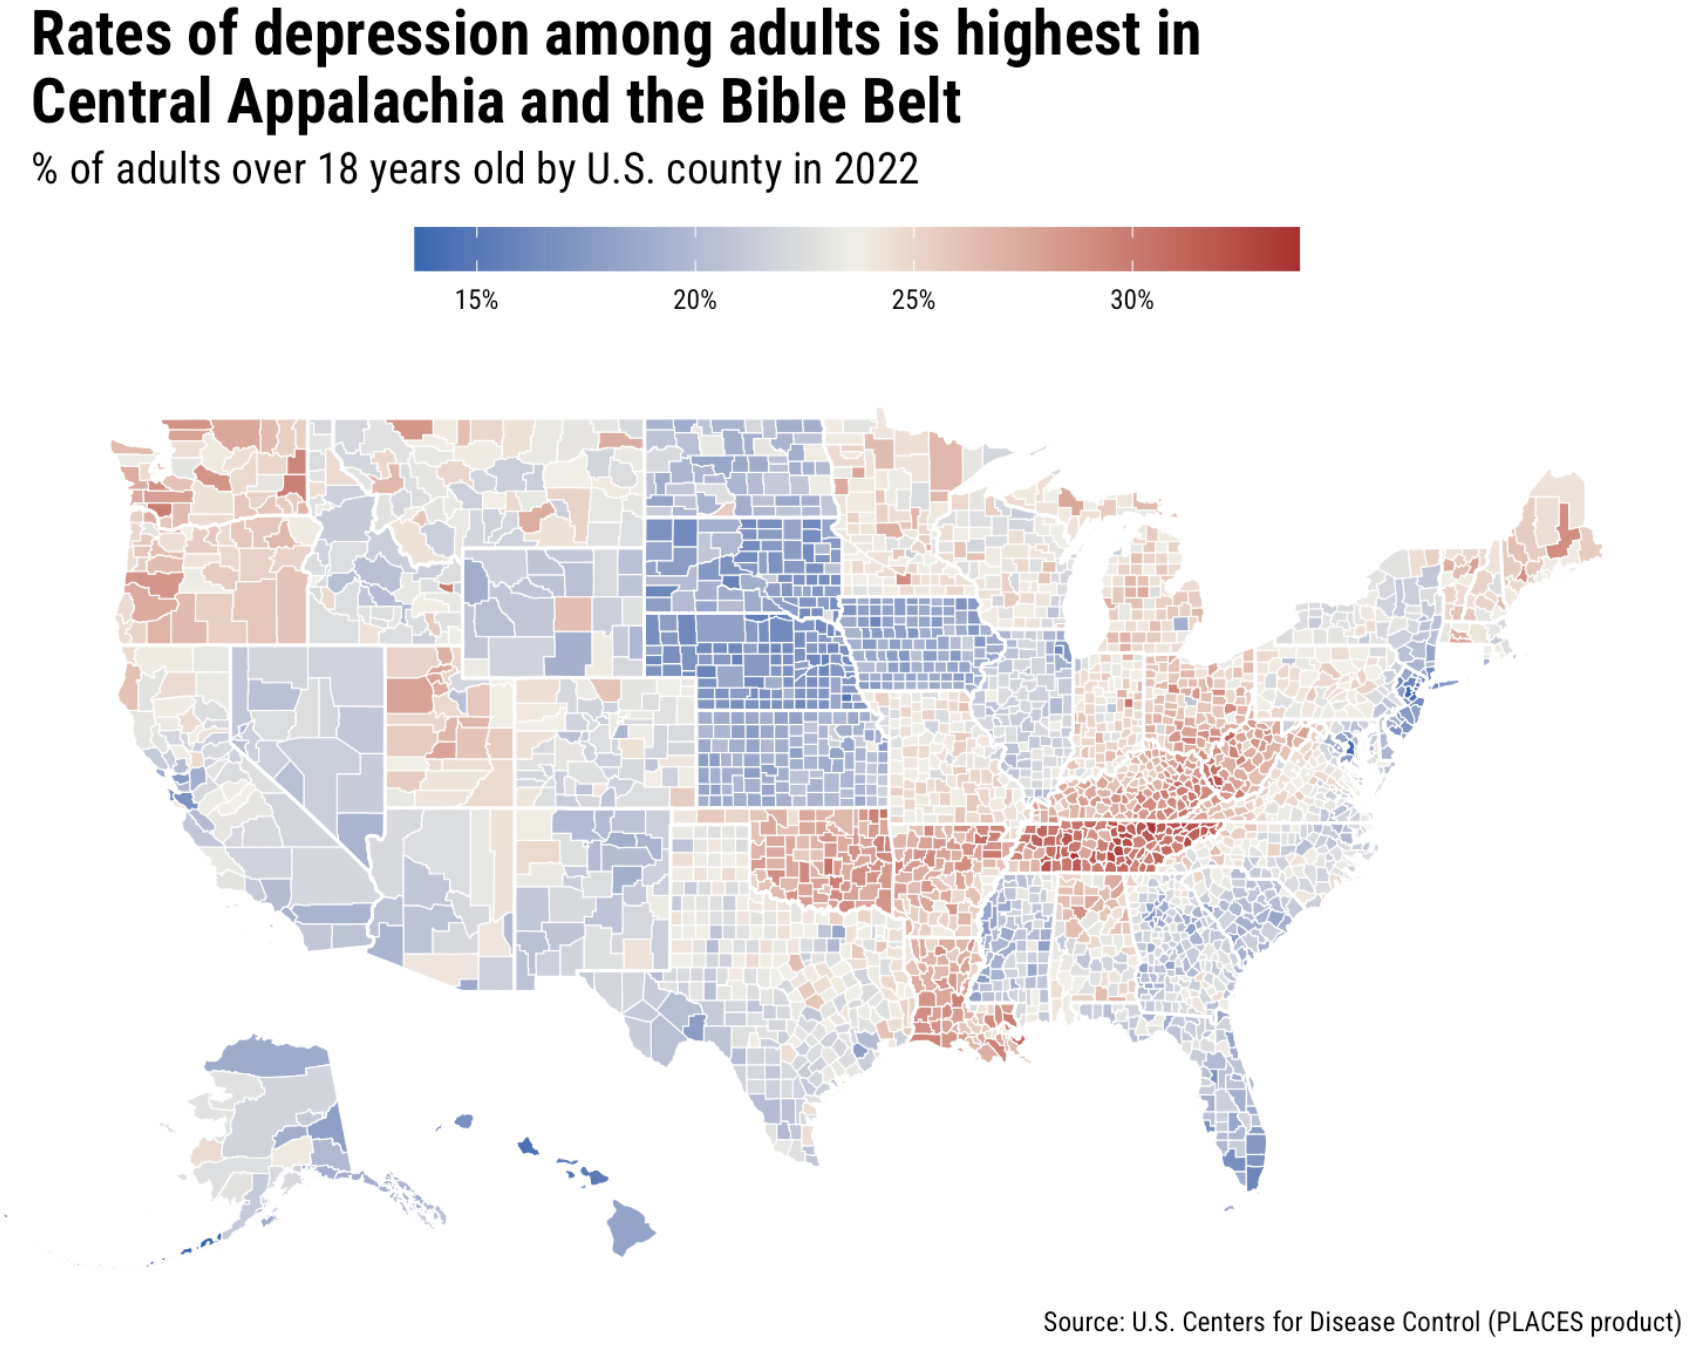
This post shows how to fetch data from the CDC and analyze and map it simply

Mickey Rafa
Sep 30, 2024

Reviewing the ACS-1 2023 child poverty estimates
R
data-viz
tidyverse
tidycensus
api
purrr

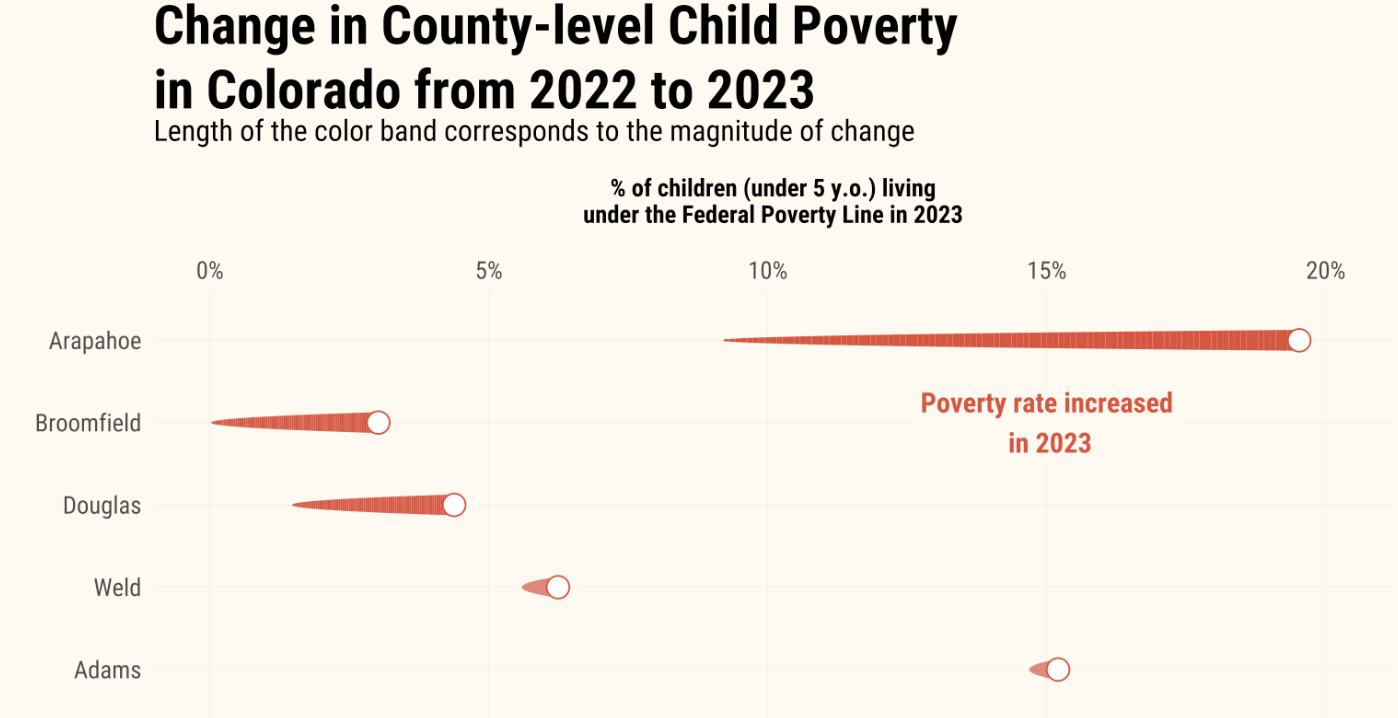
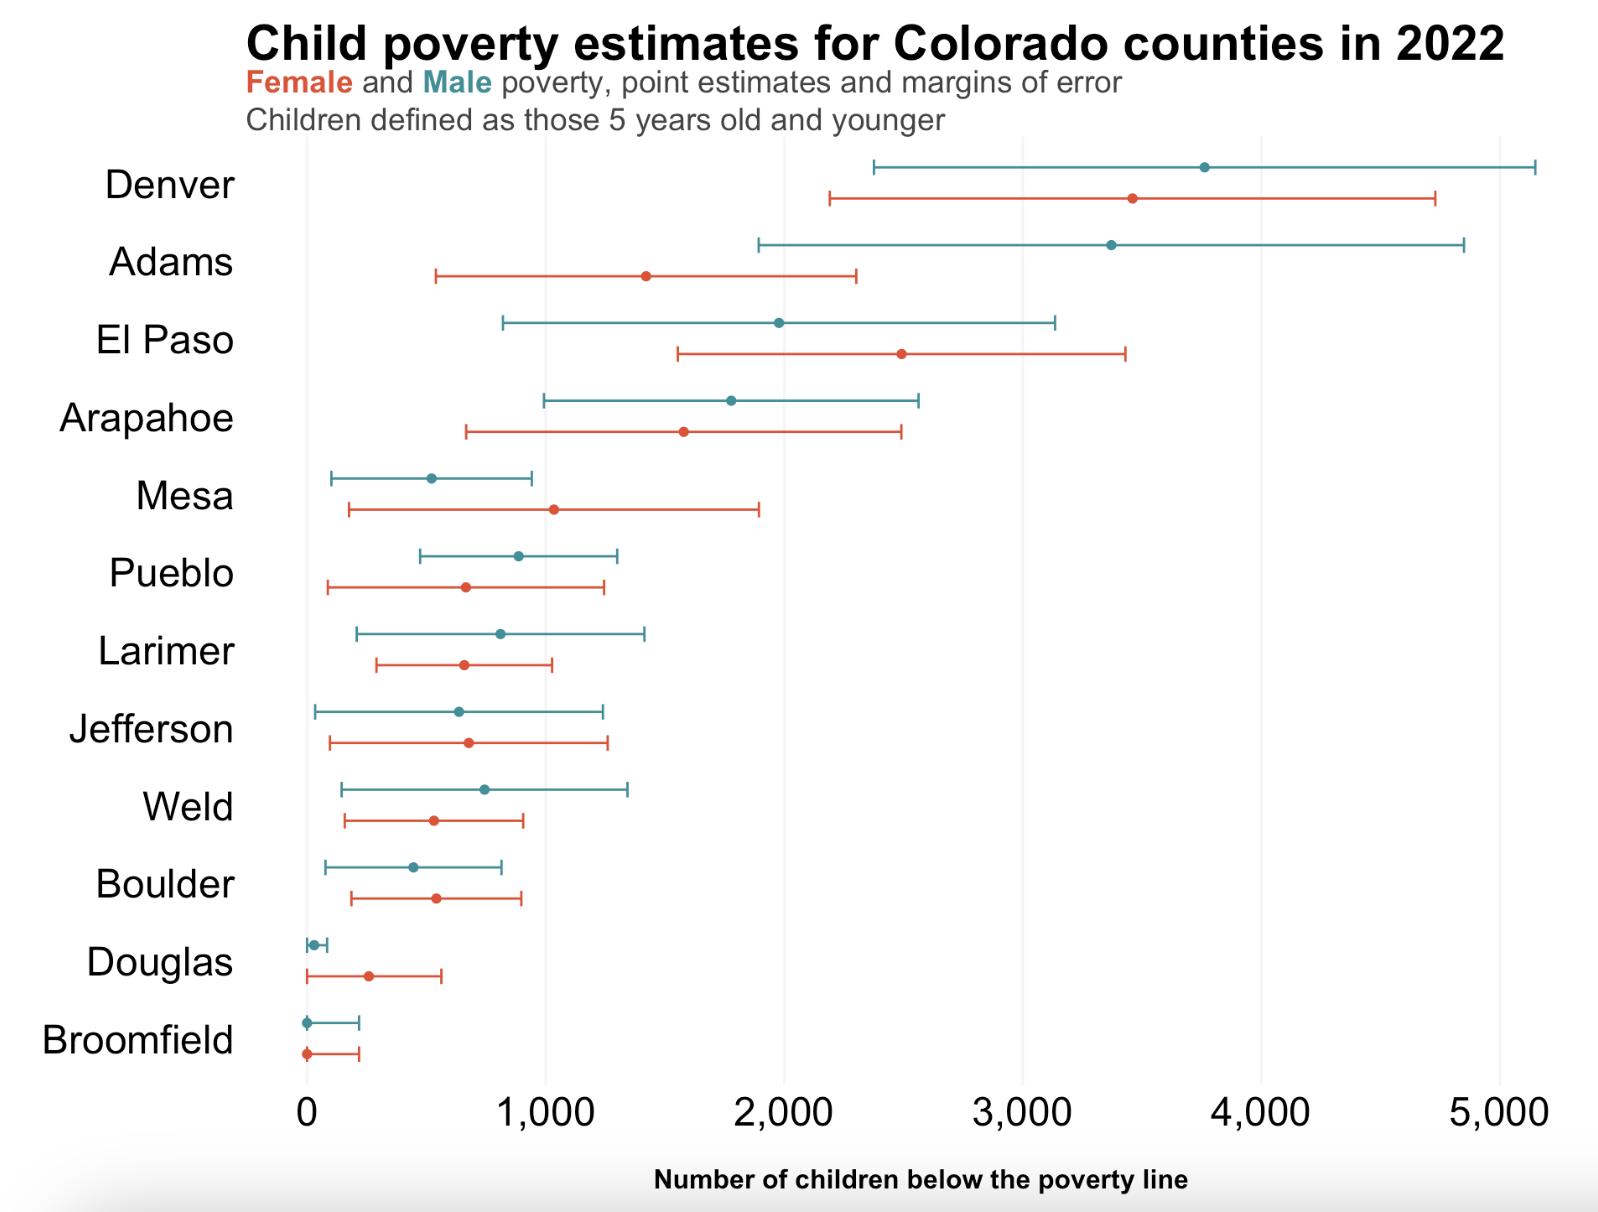
This post looks at how child poverty estimates have changed in the latest U.S. Census data

Mickey Rafa
Sep 12, 2024

Analyzing CPI with Python and R
Python
pandas
api
data-viz
plotnine
R
Quarto
regression
matplotlib

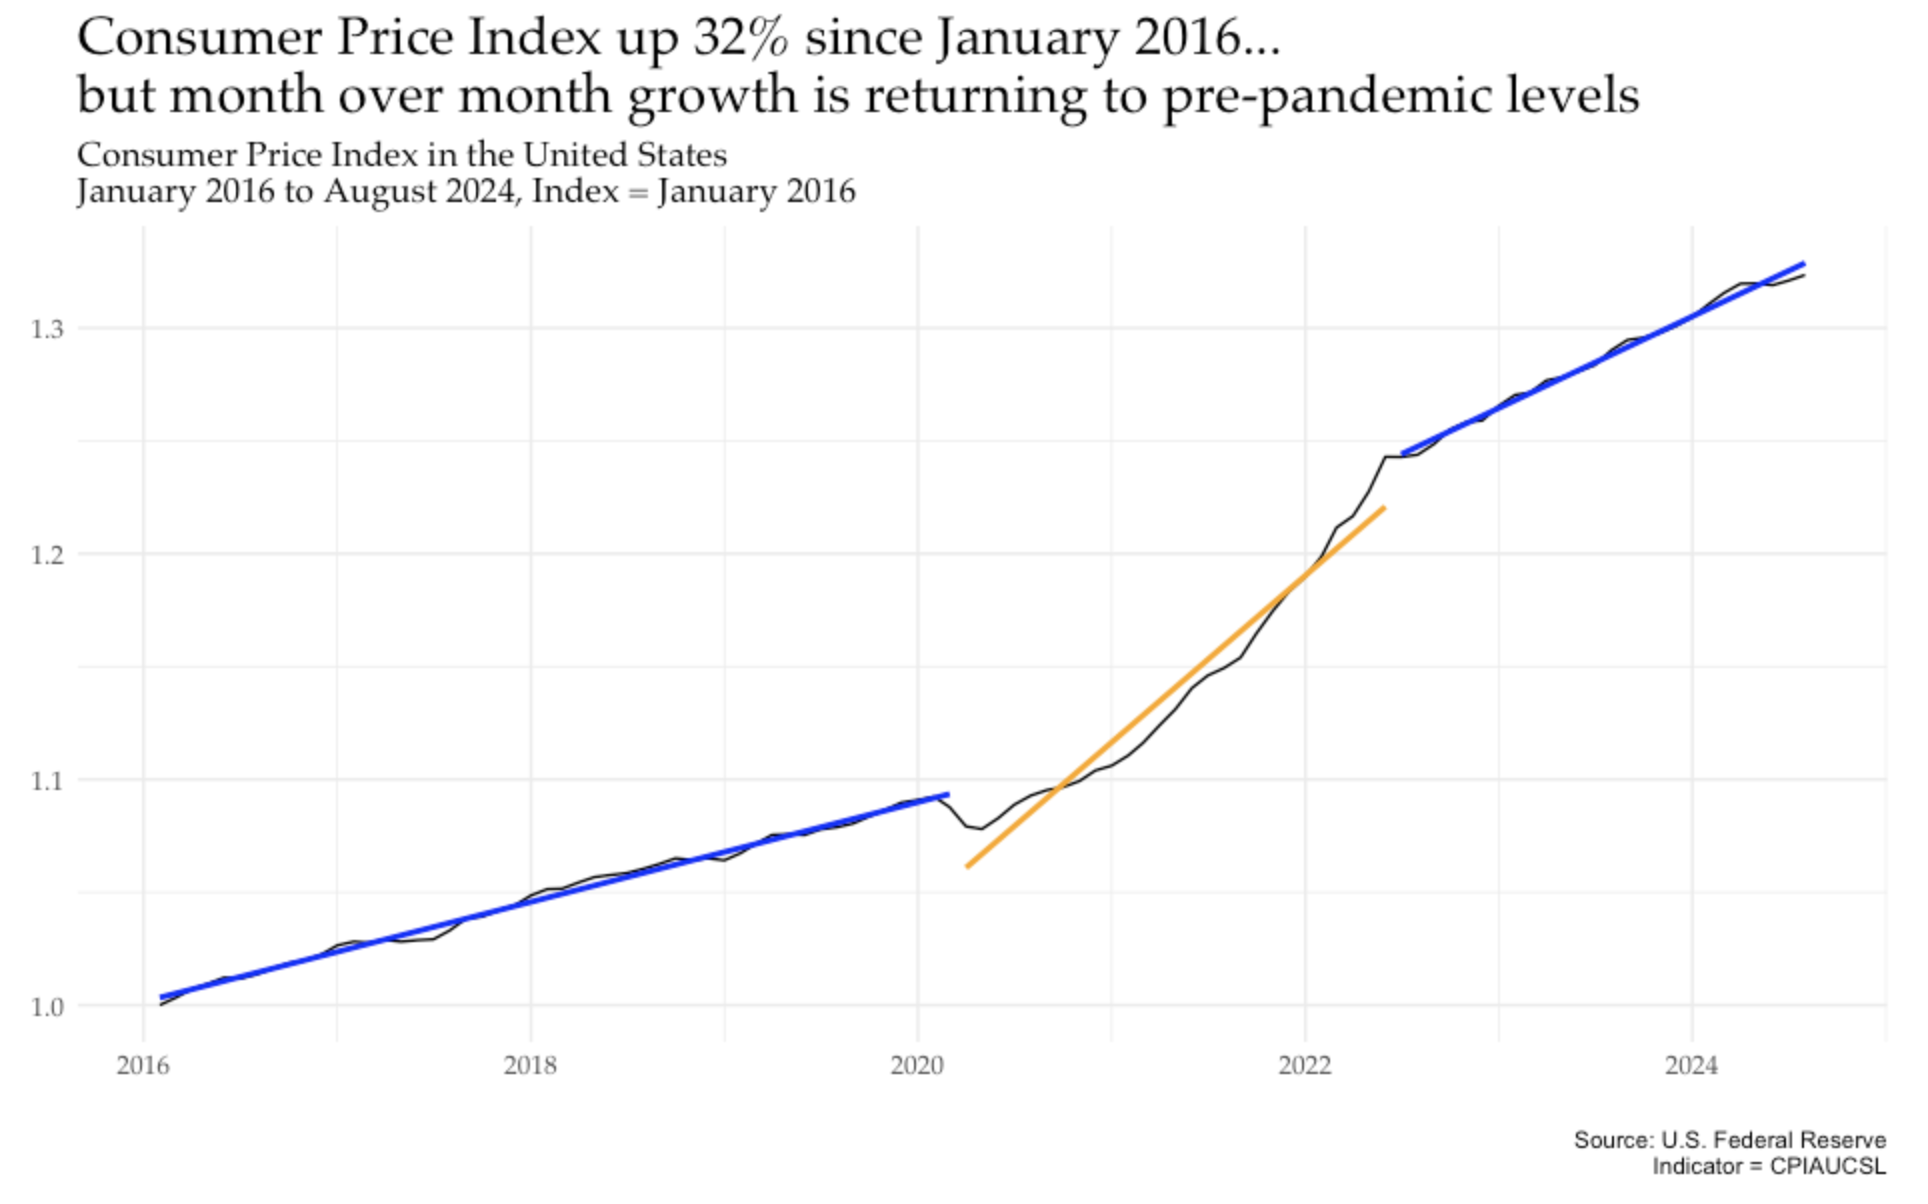
Accessing, analyzing, and visualizing data from the Federal Reserve

Mickey Rafa
Sep 11, 2024

Part Three: Exploring even smaller geographies with tidycensus
R
tidyverse
tidycensus
mapping
api

This post shows how to fetch data at smaller scales for analysis of Census data

Mickey Rafa
Aug 28, 2024

Part Two: Wrangling Census data for longitudinal analysis of child poverty
R
data-viz
tidyverse
tidycensus
api
javascript
purrr

This post shows how to fetch many years of data simply, unlocking longitudinal analysis of Census data

Mickey Rafa
Aug 20, 2024

Setting up an EPA air quality database using DuckDB
R
tidyverse
duckdb
environment
sql
api

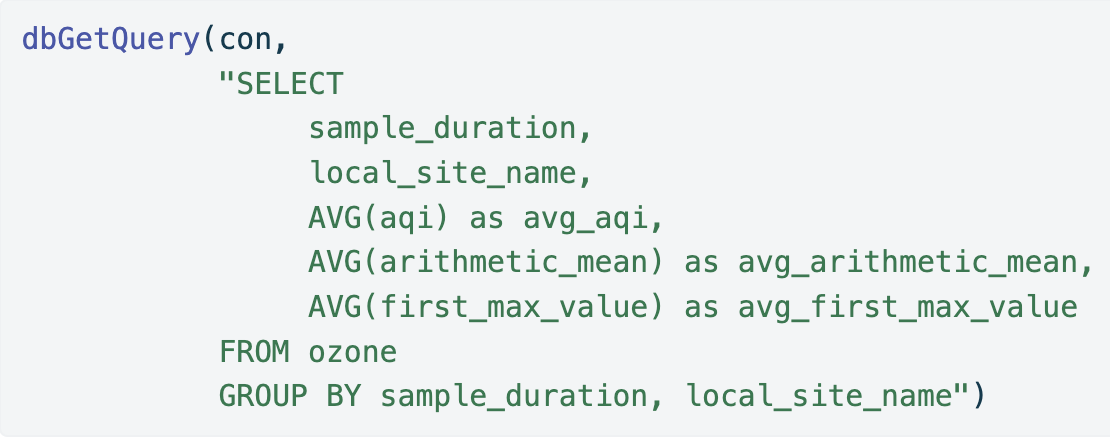
This post uses the RAQSAPI package to access the EPA API and query the results with DuckDB

Mickey Rafa
Aug 18, 2024

Part One: Exploring child poverty data with the tidycensus R package
R
tidyverse
mapping
gt
tidycensus
api

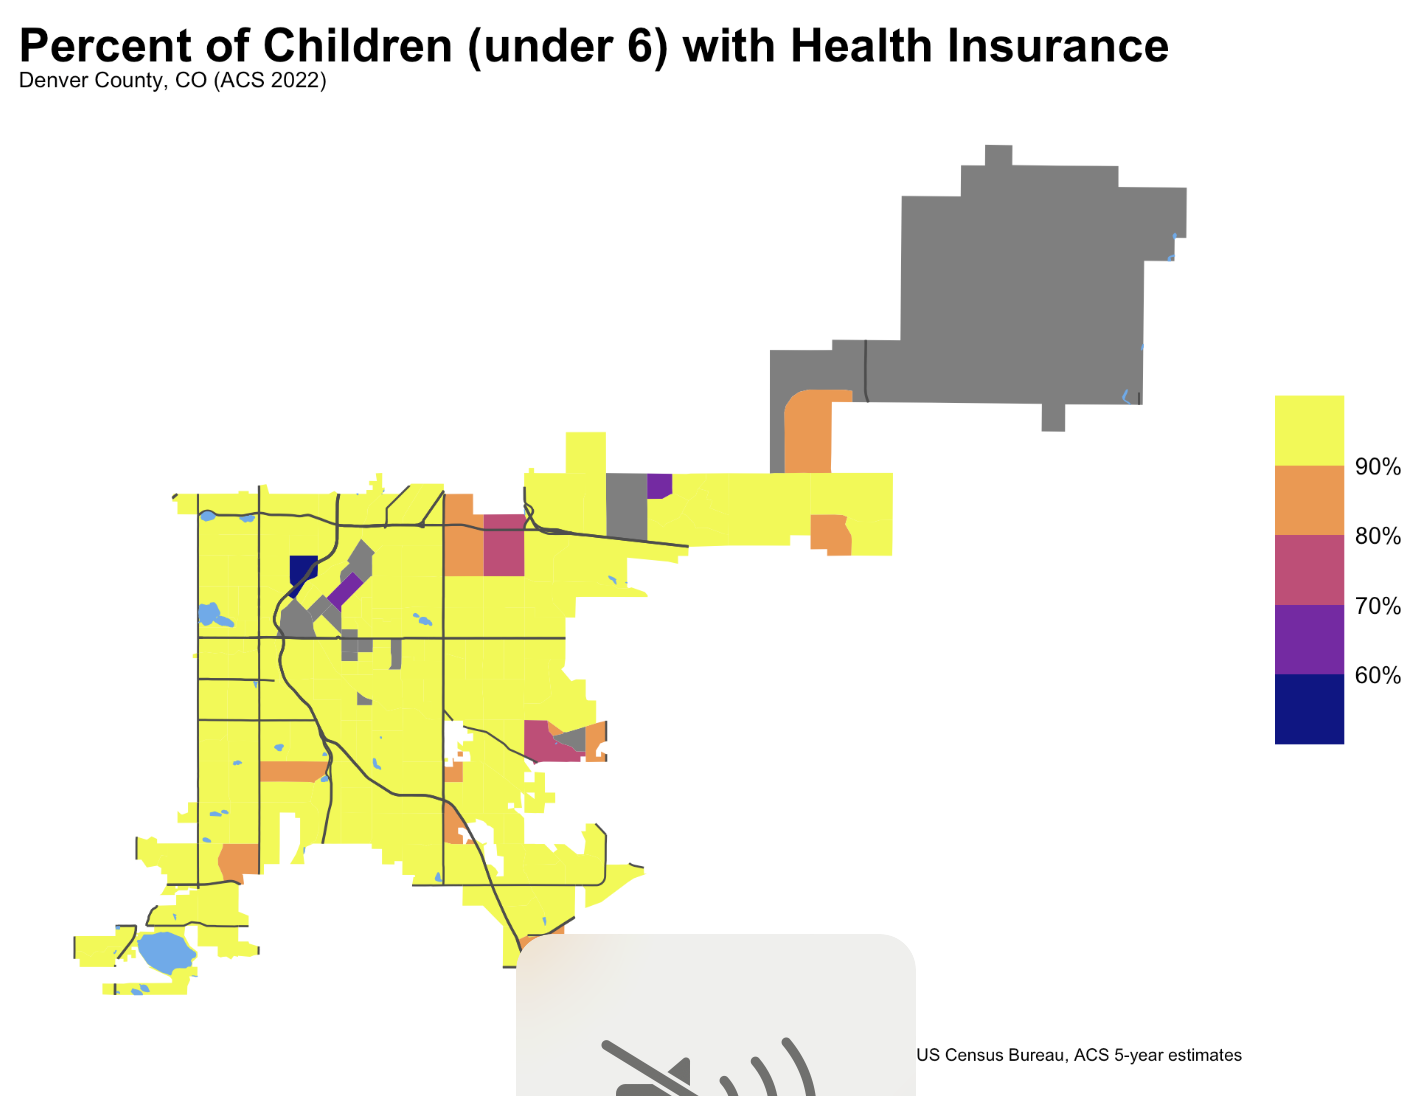
This post uses the tidycensus package to access the Census API and visualize data on child poverty in the U.S.

Mickey Rafa
Aug 13, 2024

Exploring interactive mapping with mapboxgl
R
tidyverse
mapping

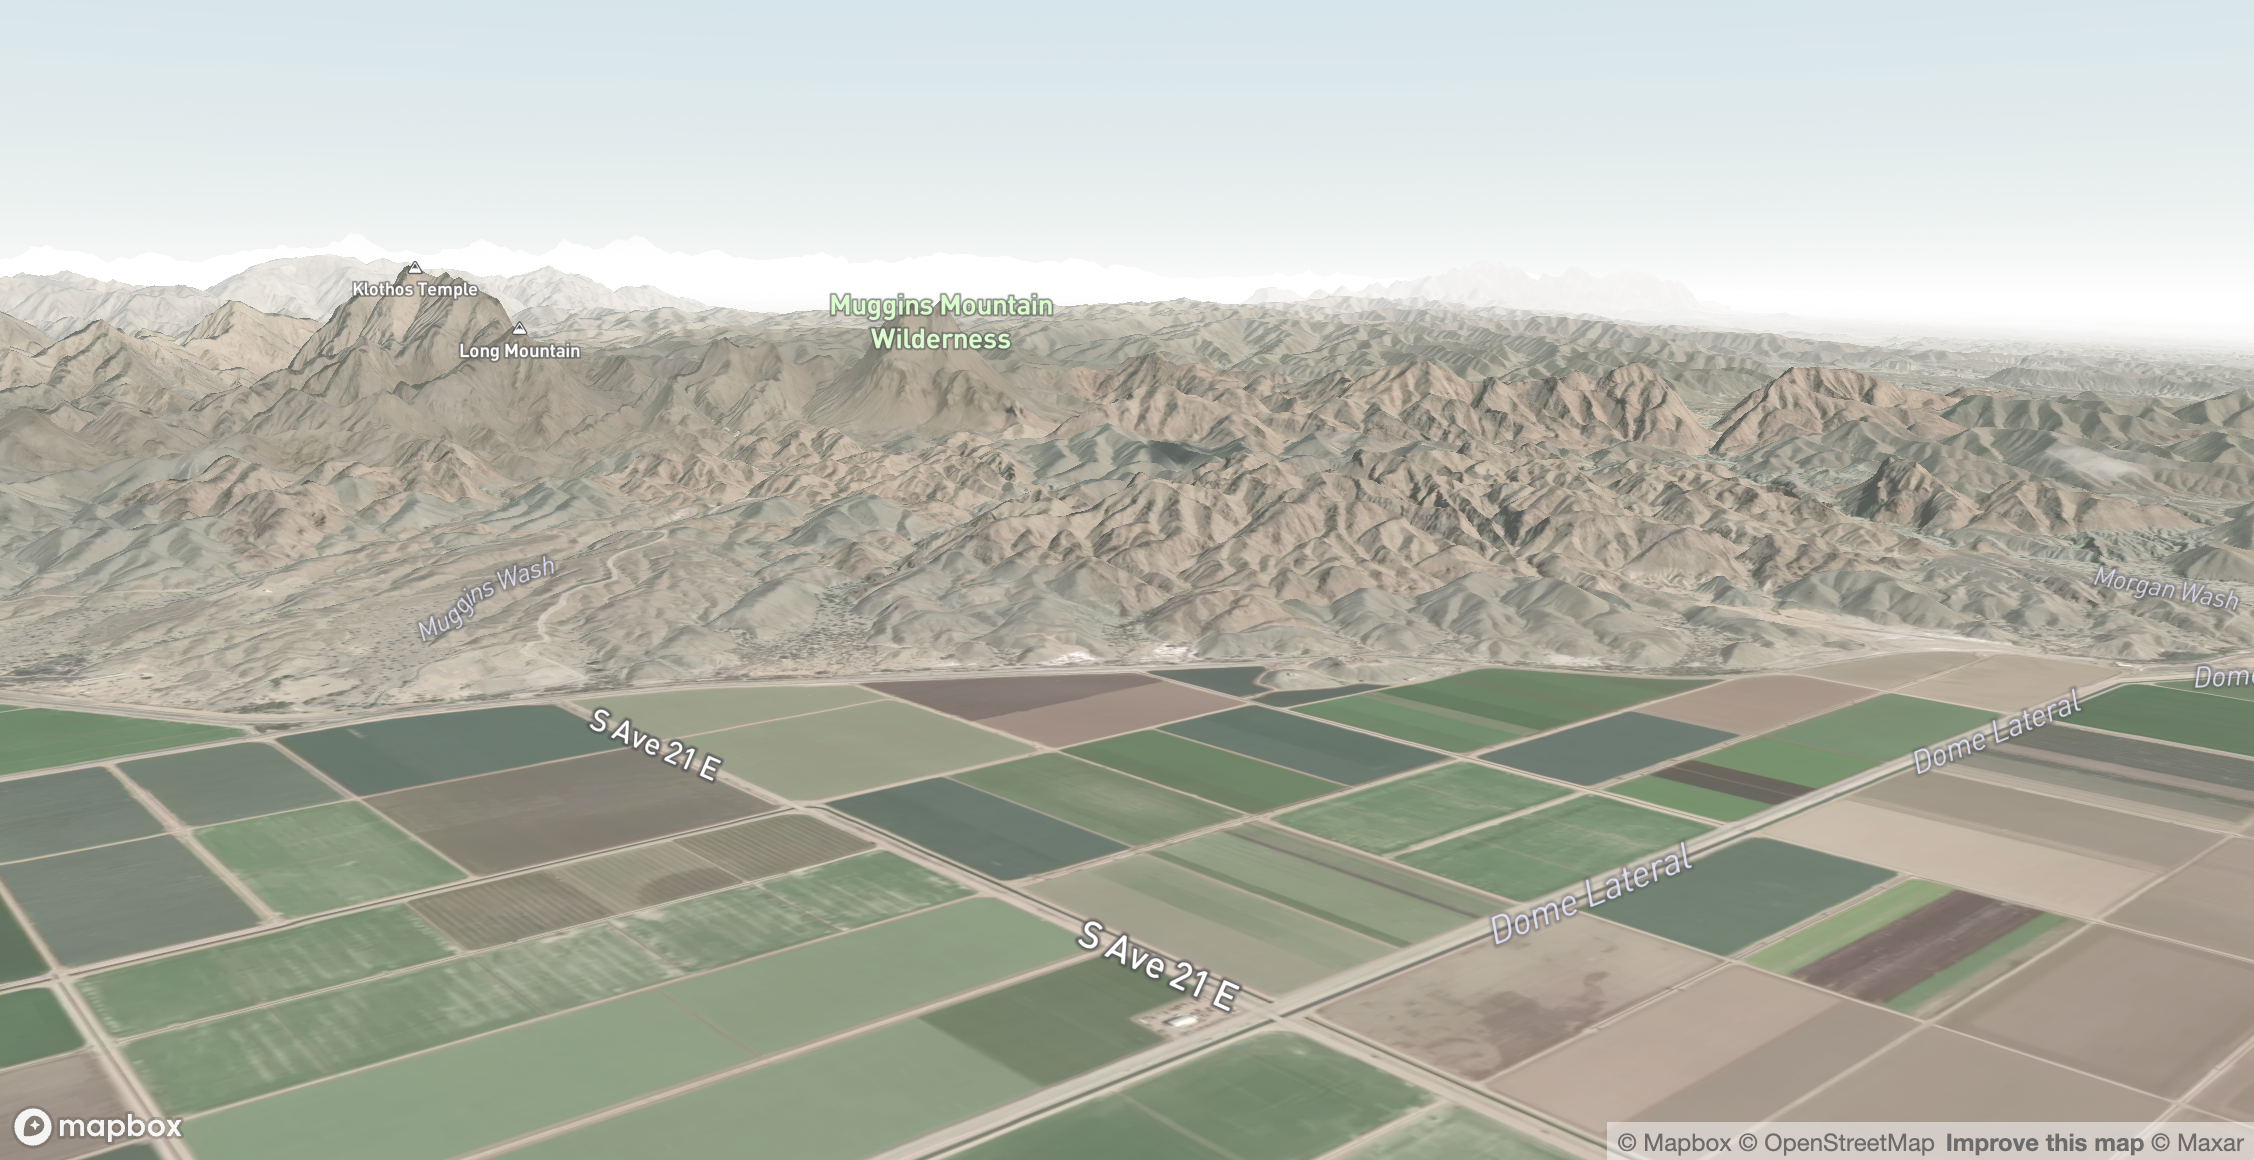
This post explores some mapboxgl features

Mickey Rafa
Aug 2, 2024

BrainTree SQL challenge
SQL
Quarto

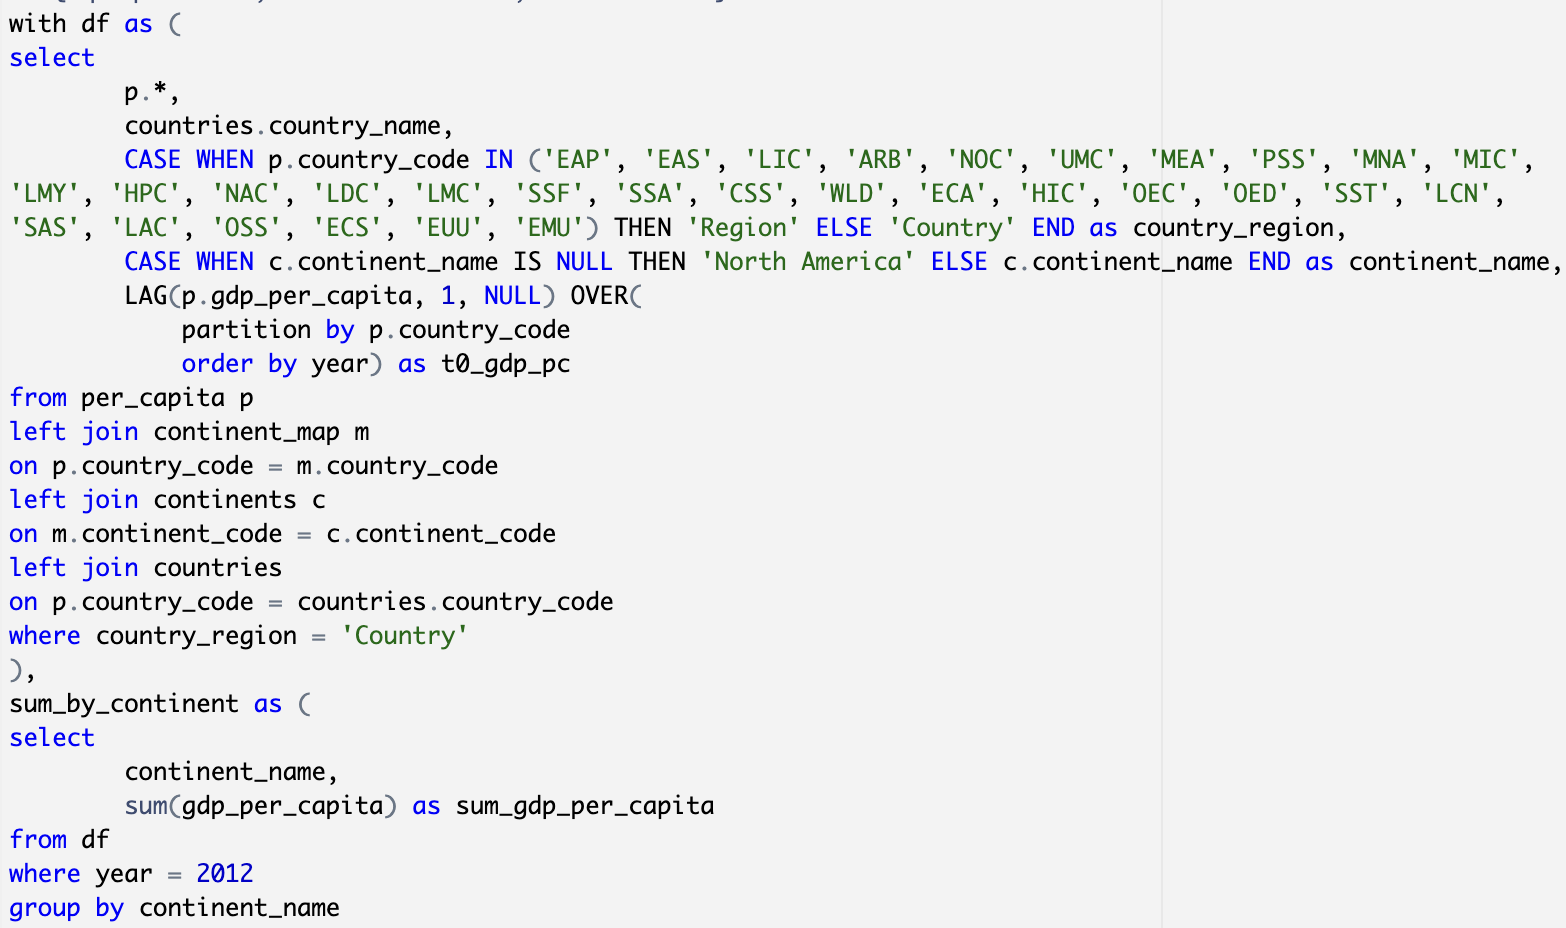
This post works through the SQL challenges used by PayPal

Mickey Rafa
Jul 30, 2024

Query comparison: SQL, R, and Python using Chicago Employees dataset
R
SQL
Python
Quarto
generative-AI

This post demonstrates how to run these languages in Quarto

Mickey Rafa
Jul 24, 2024

Data Science Workflows in Javascript: Part Three
Quarto
Javascript
data-viz
pca
environment

This post is from the third session led by Observable HQ

Mickey Rafa
Jul 29, 2023

Data Science Workflows in Javascript: Part Two
Quarto
Javascript
data-viz
cluster-analysis
environment

This post is from the second session led by Observable HQ

Mickey Rafa
Jul 22, 2023

Data Science Workflows in Javascript: Part One
Quarto
Javascript
data-viz
regression
environment

This post is from the first session led by Observable HQ

Mickey Rafa
Jul 11, 2023

Building beautiful tables with the gt:: package in R
R
web-scraping
gt
sports

This post outlines how to quickly scrape and clean data from Wikipedia and build a beautiful table in R

Mickey Rafa
Dec 23, 2022

PART TWO: Mapping of African Health Clusters
R
data-viz
tidyverse
international-development
cluster-analysis
mapping

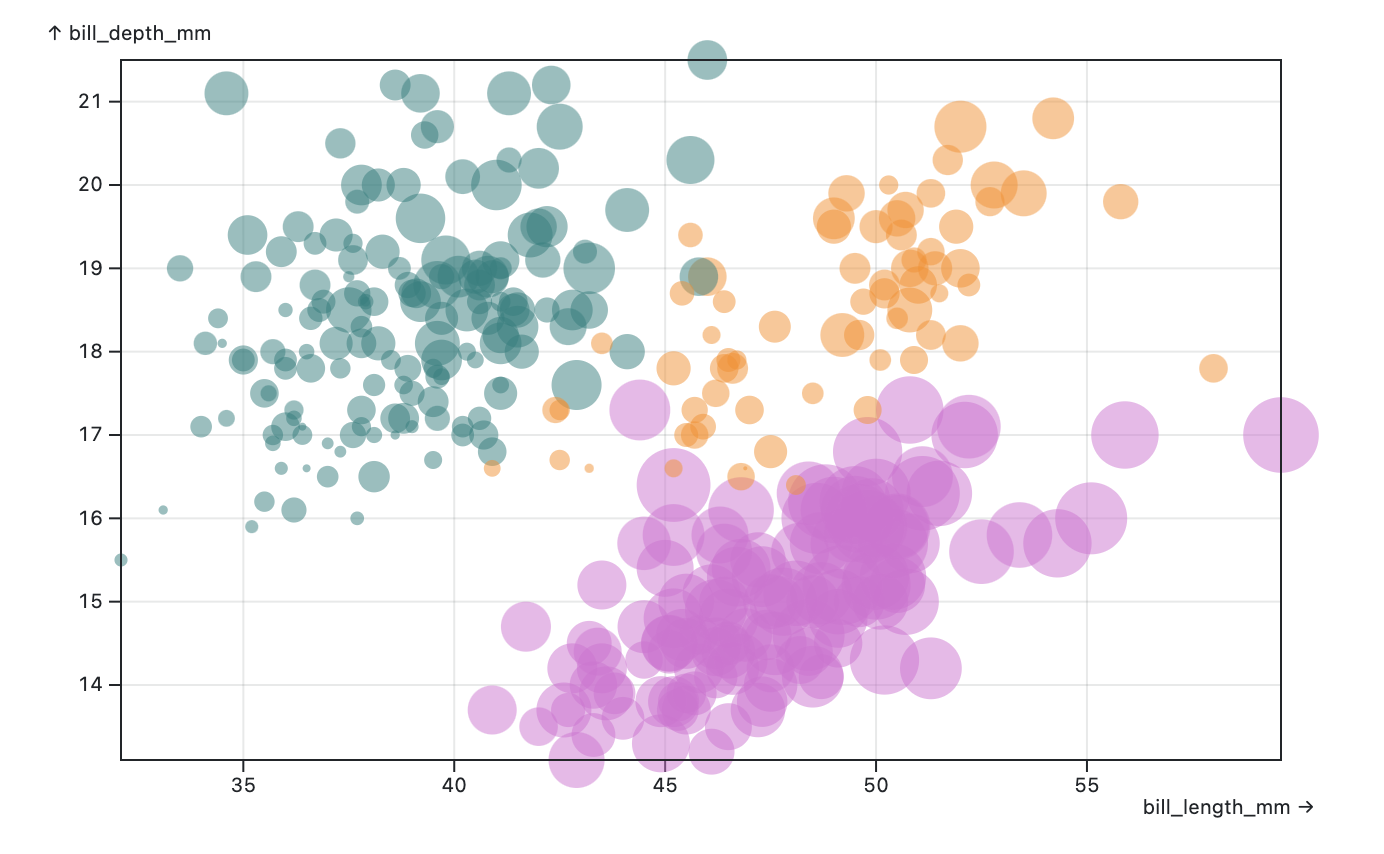
Creating maps of cluster results using ggplot

Mickey Rafa
Jun 18, 2019

PART ONE: Cluster Analysis of African Health Outcomes
R
data-viz
tidyverse
international-development
cluster-analysis

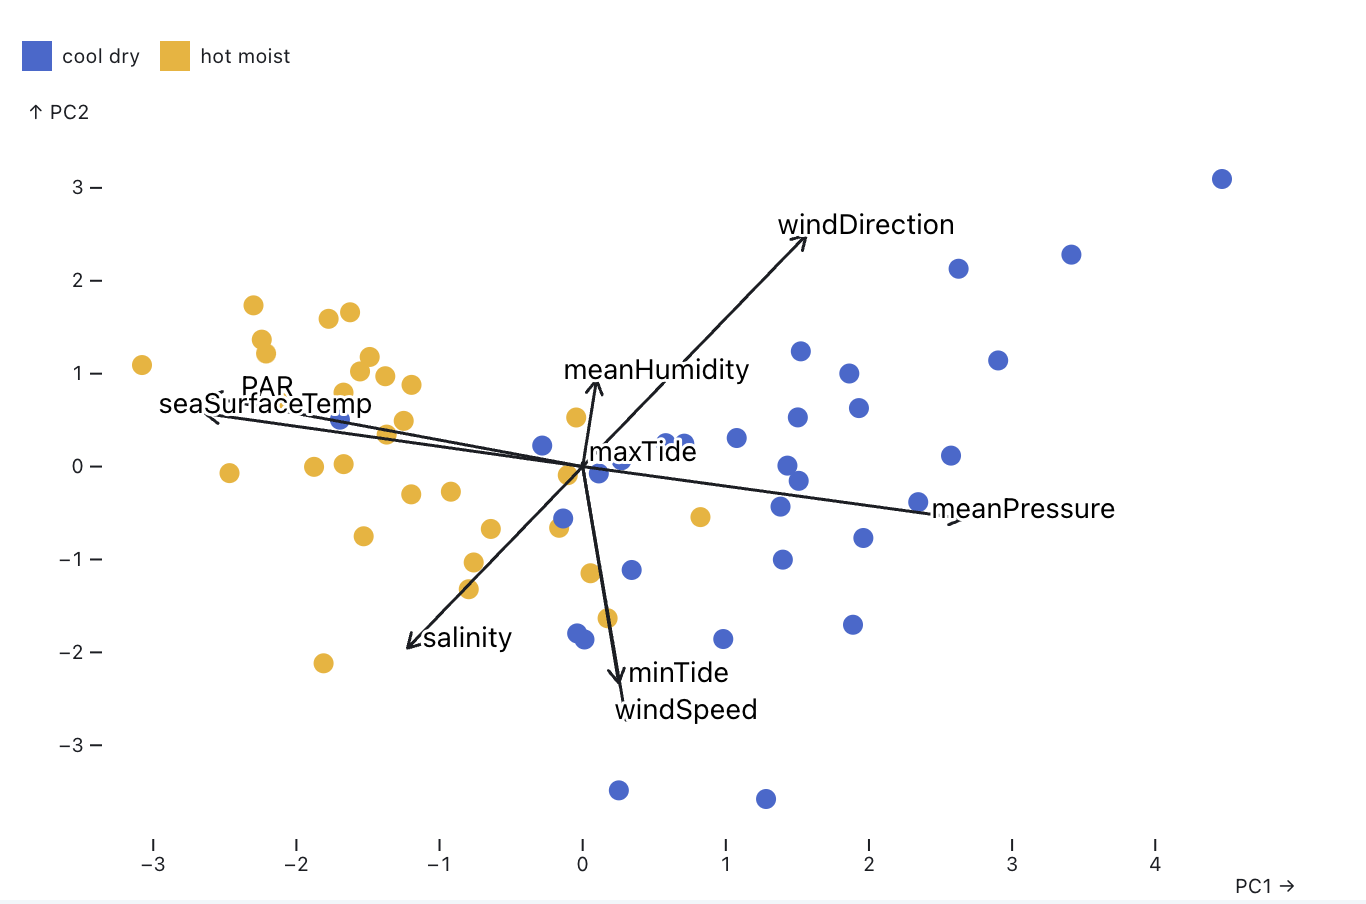
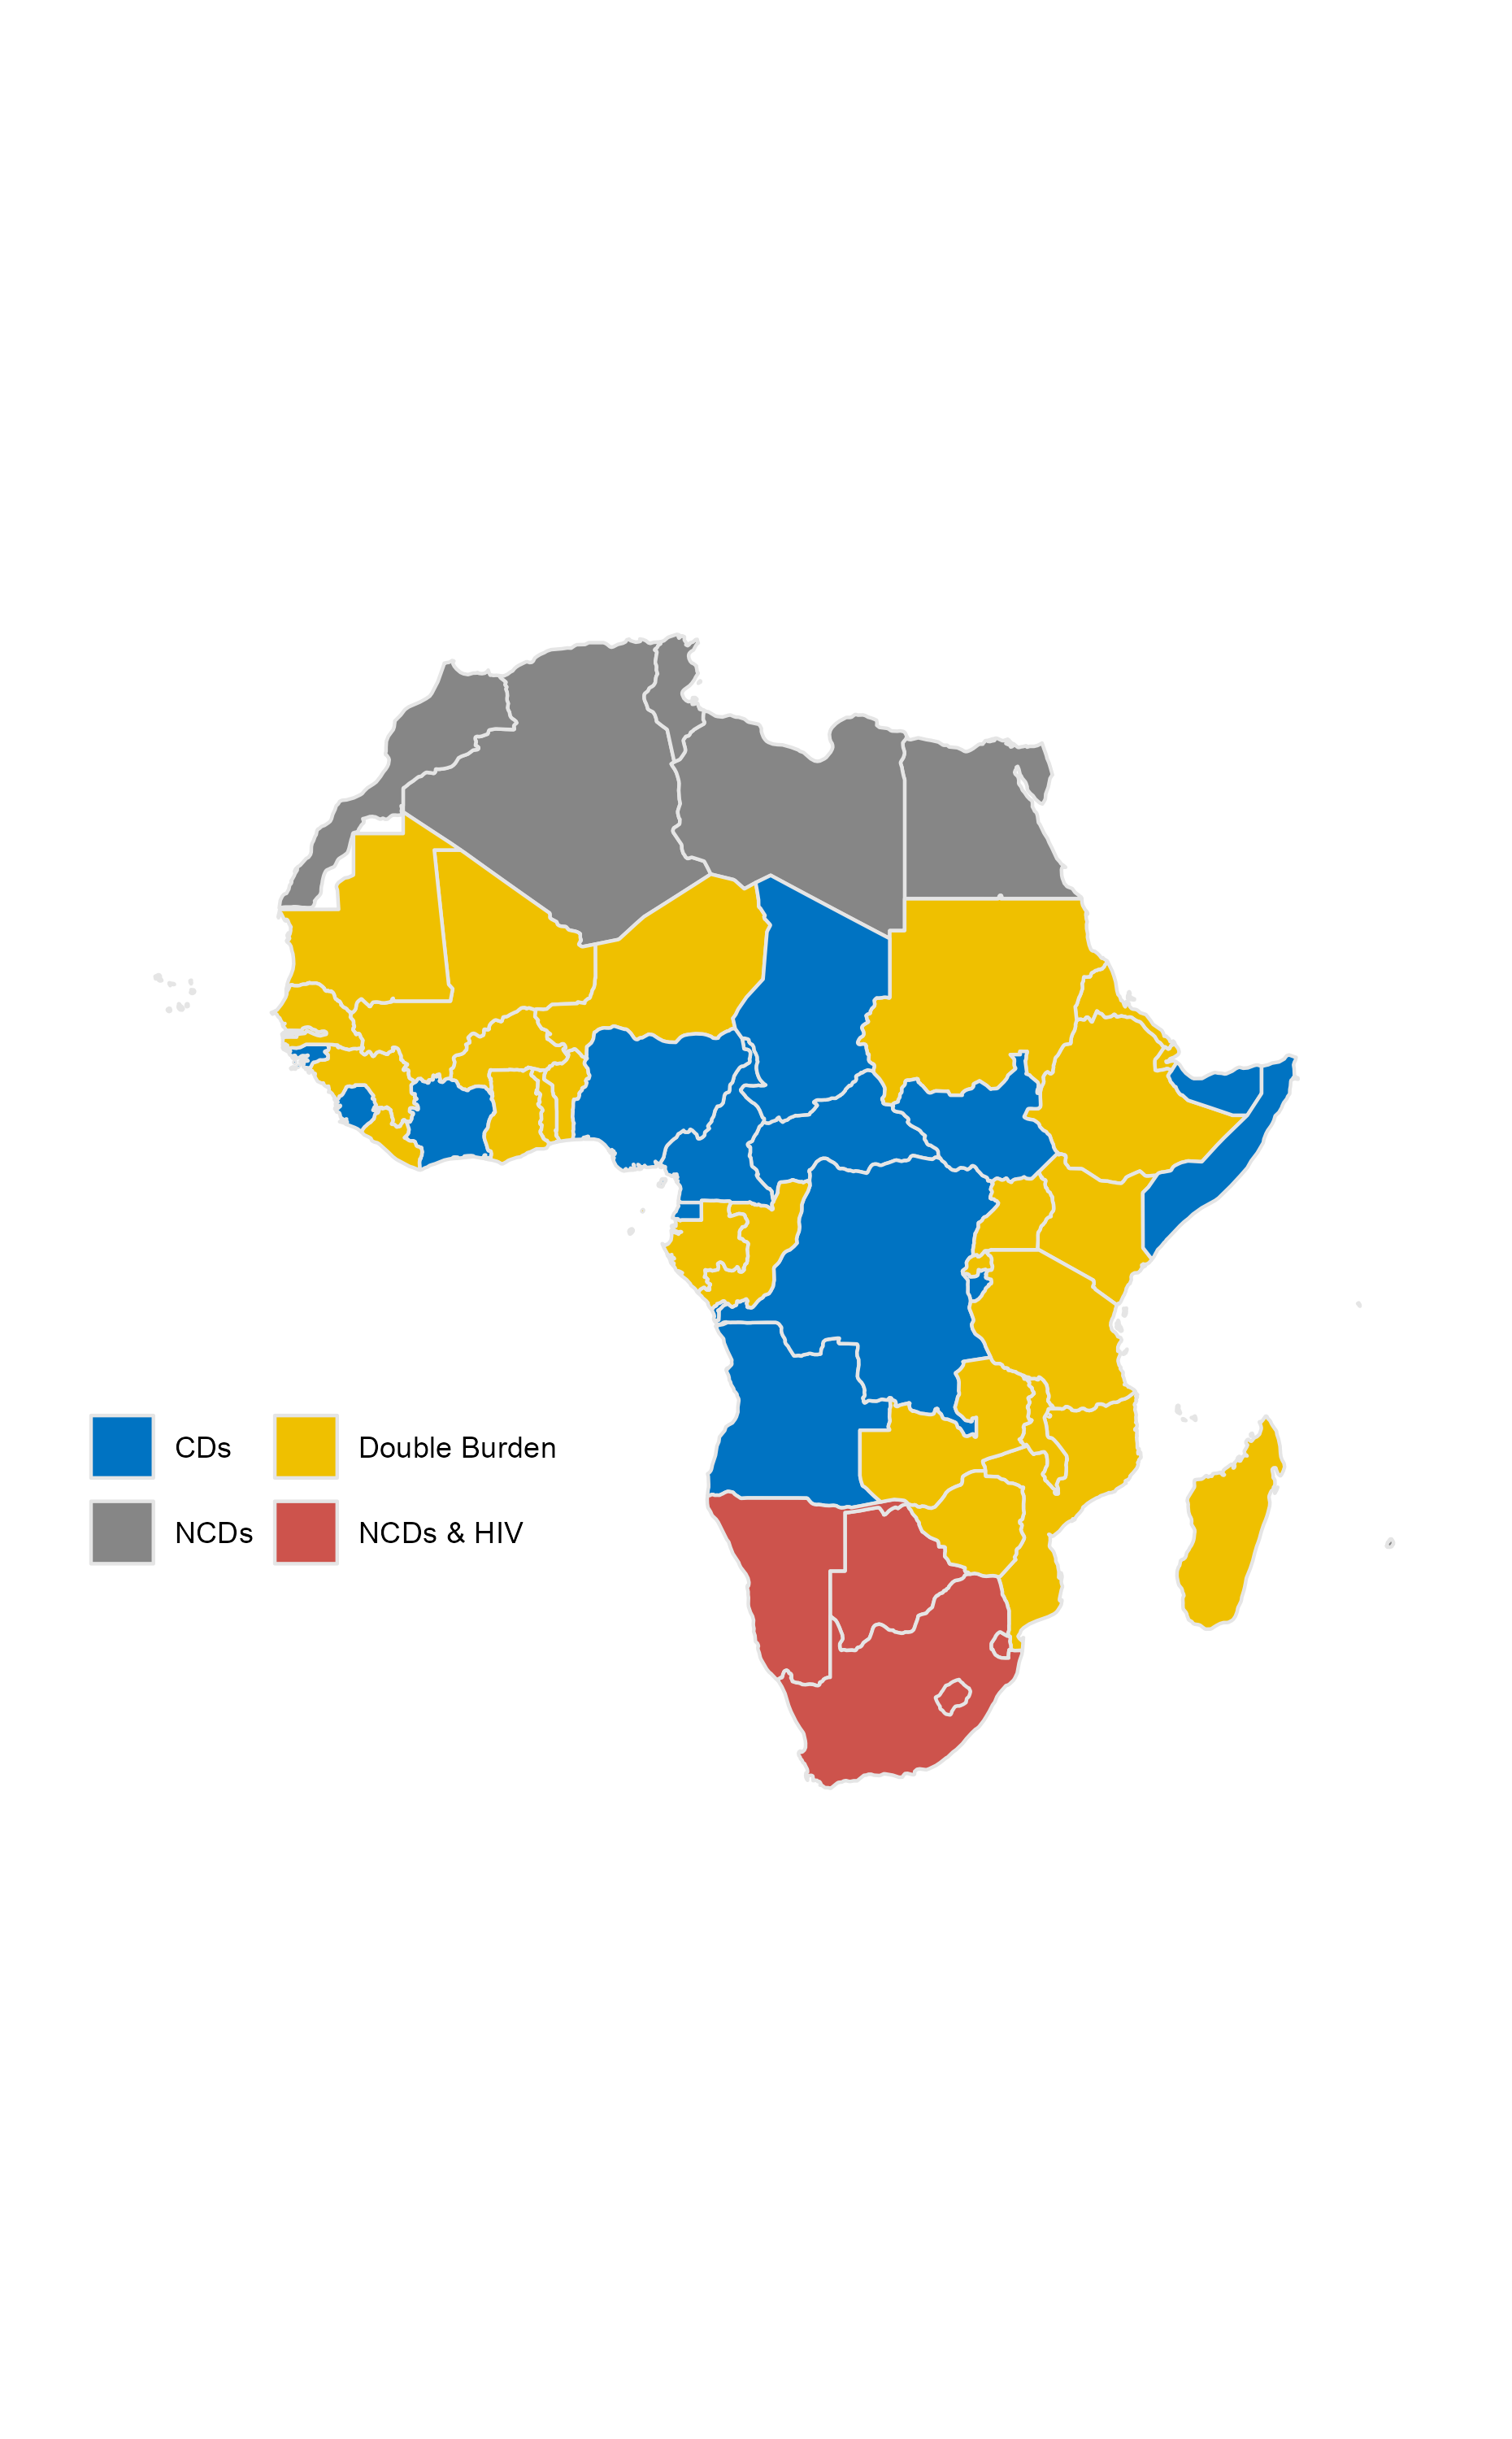
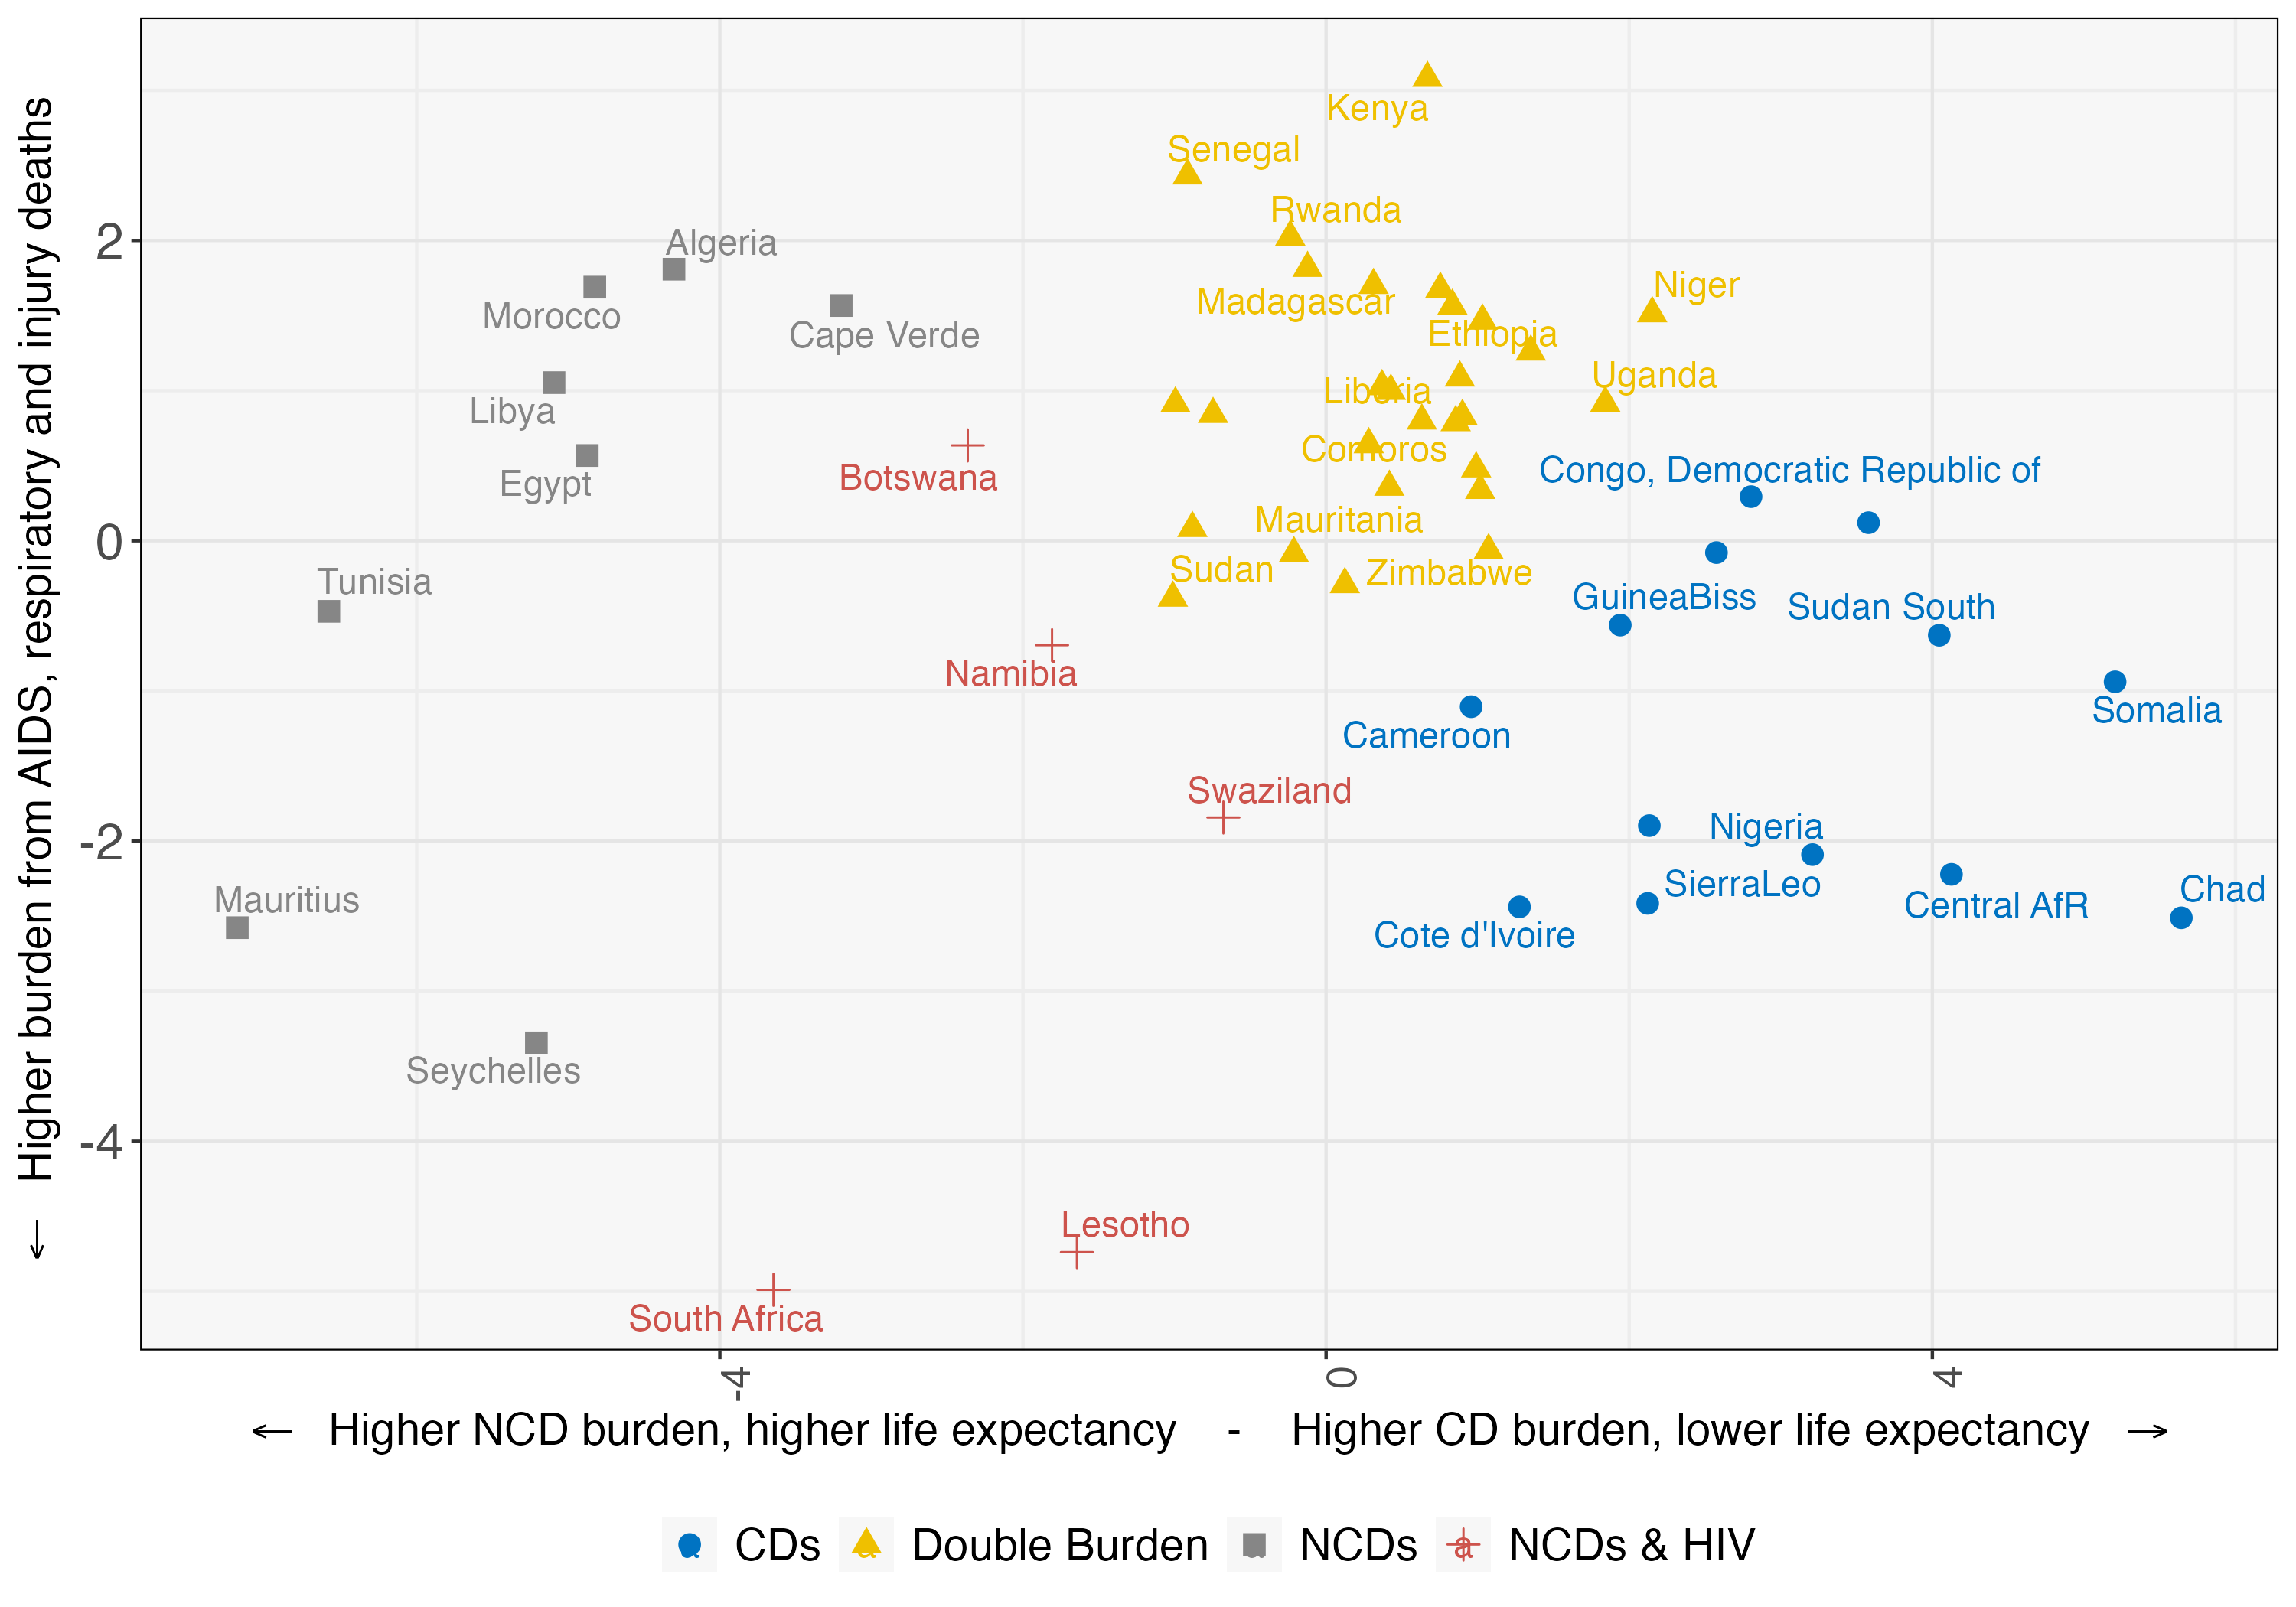
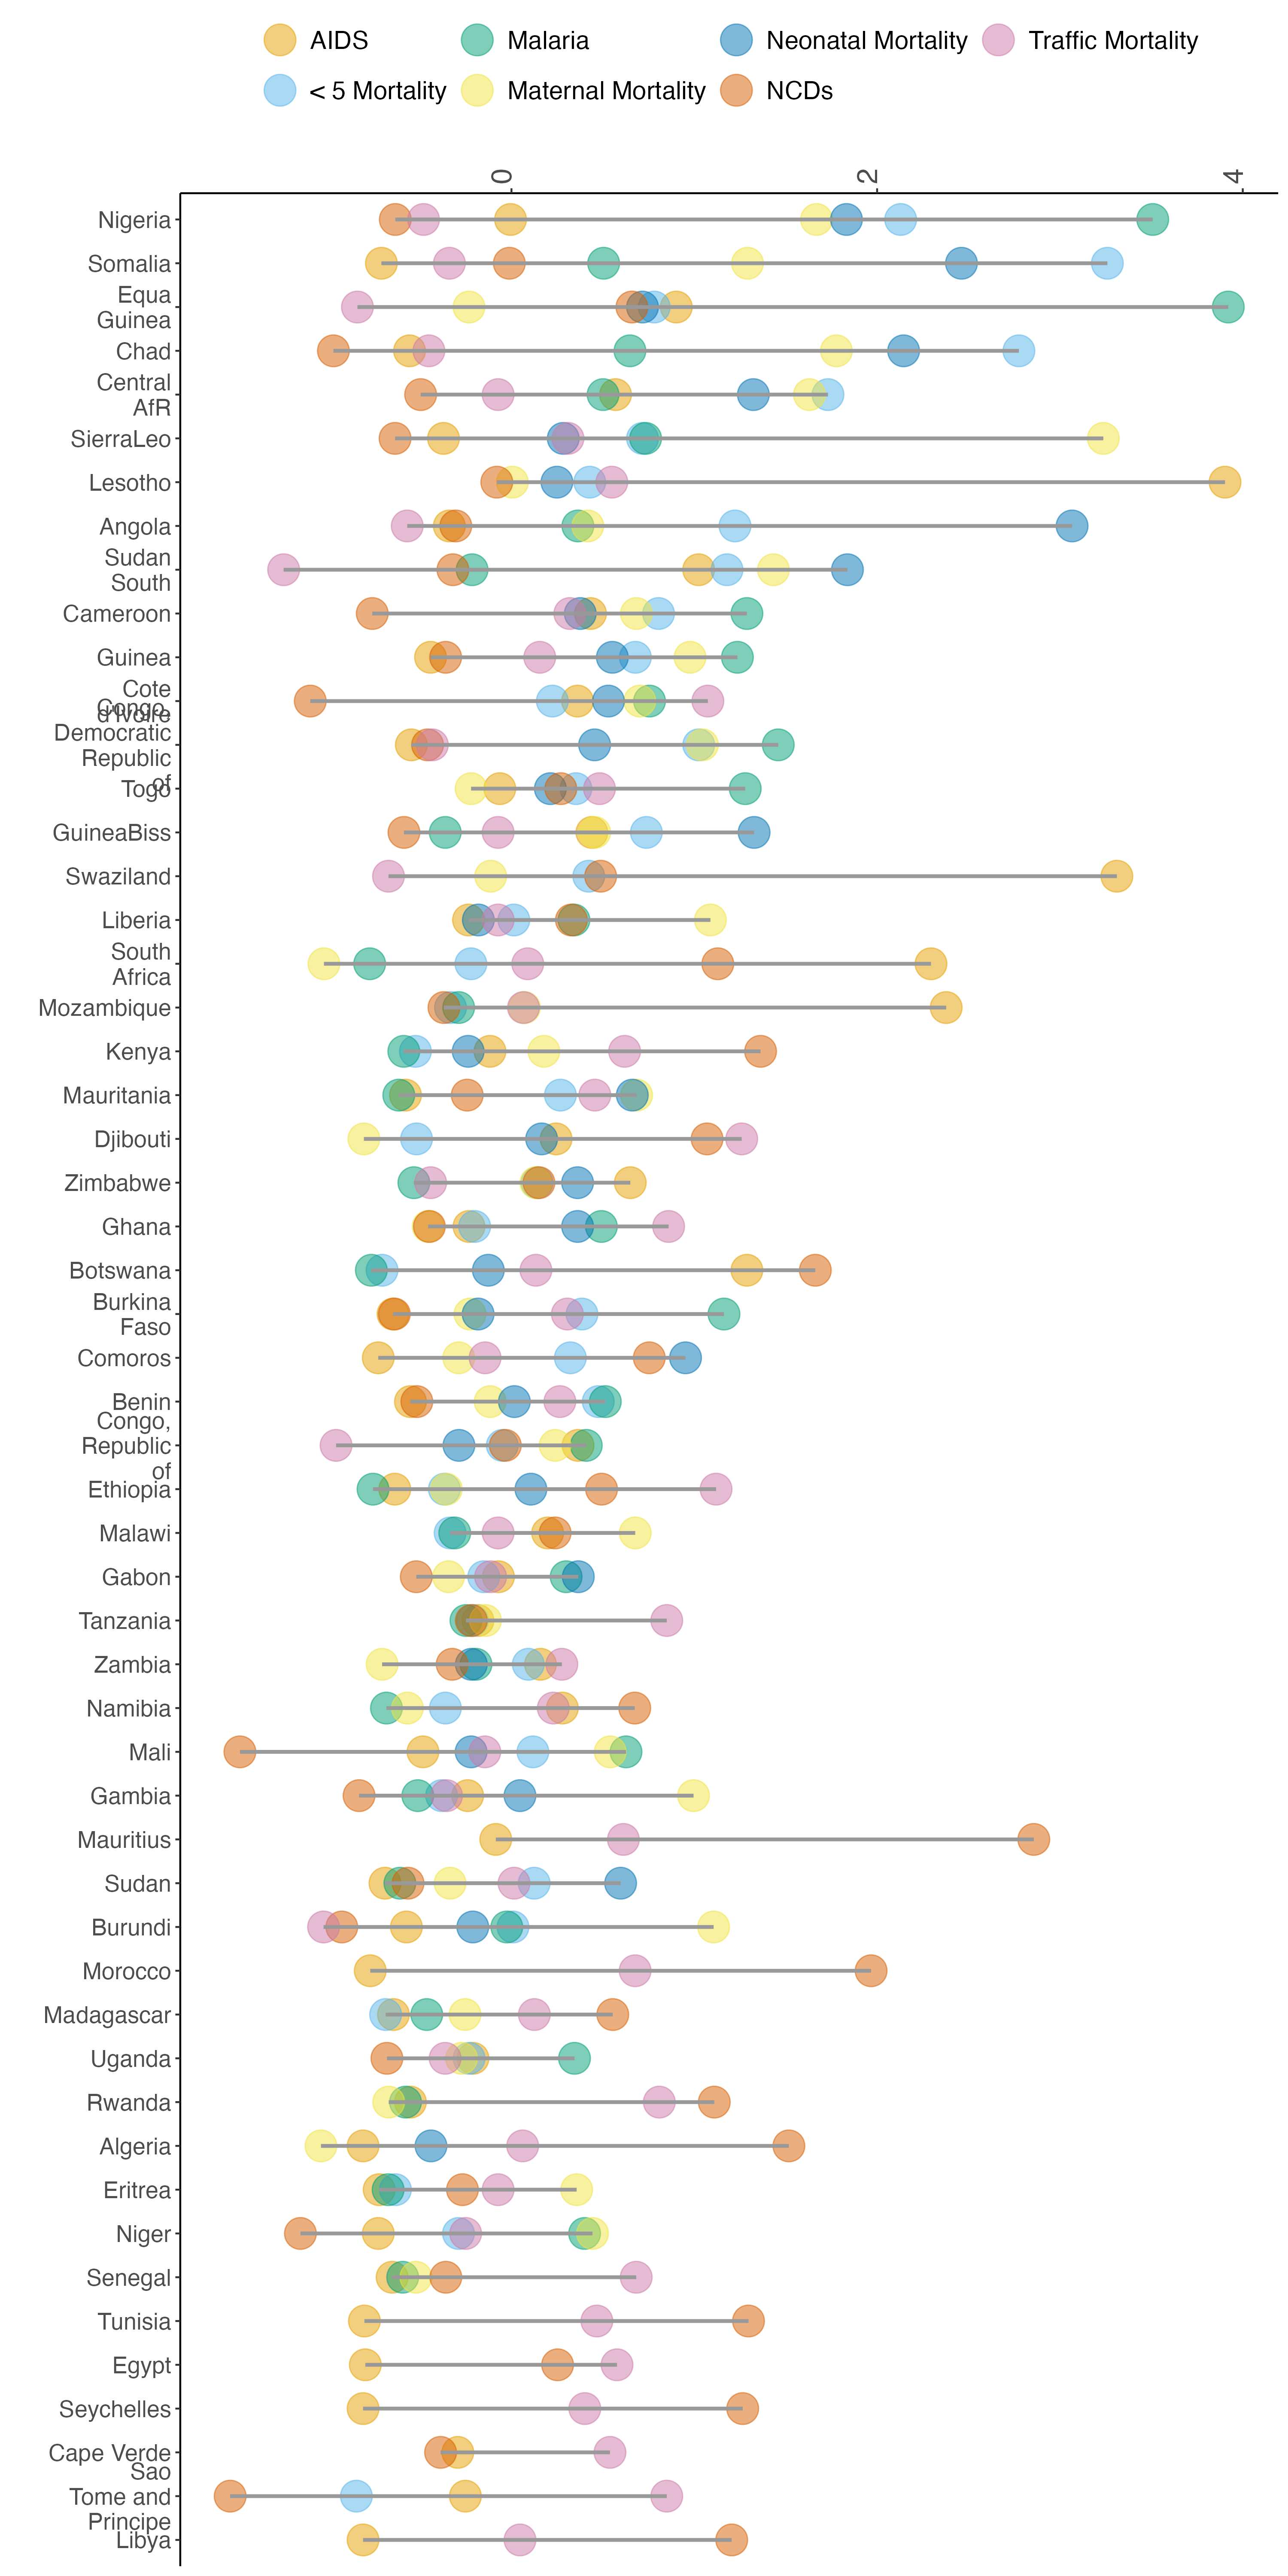
Exploring how African countries cluster based on their health outcomes

Mickey Rafa
Jun 18, 2019

Experimenting with distance as a concept for SDG achievement
R
data-viz
tidyverse
international-development
cluster-analysis
mapping

Exploring how to conceptualize and visualize distance from Sustainable Development Goal targets

Mickey Rafa
Apr 15, 2019

Animating the Gapminder dataset using gganimate
R
data-viz
tidyverse
gganimate

This post outlines how to easily add animation to ggplot graphics

Mickey Rafa
Oct 15, 2017

Analysis of Gapminder data using nested models in R
R
regression
data-viz
tidyverse
international-development

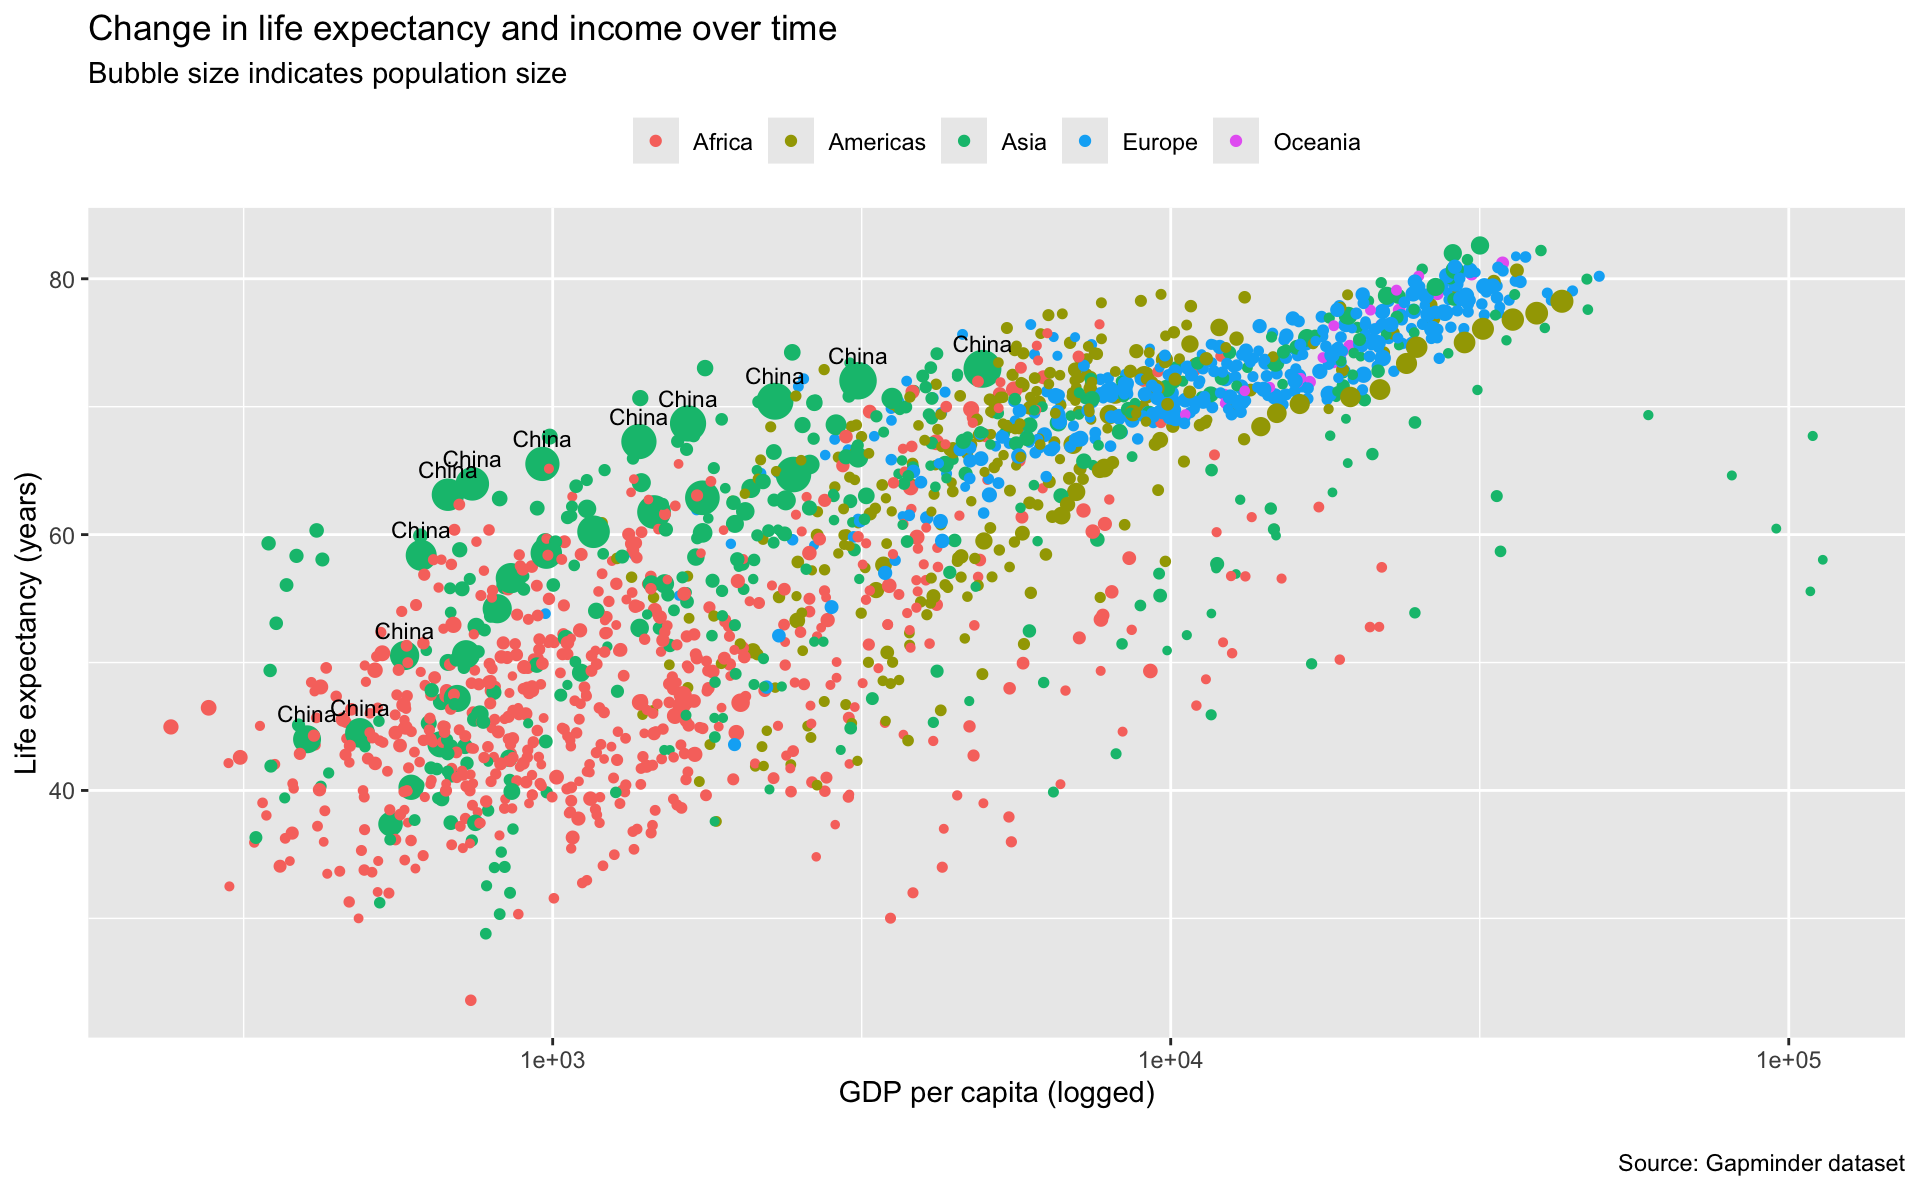
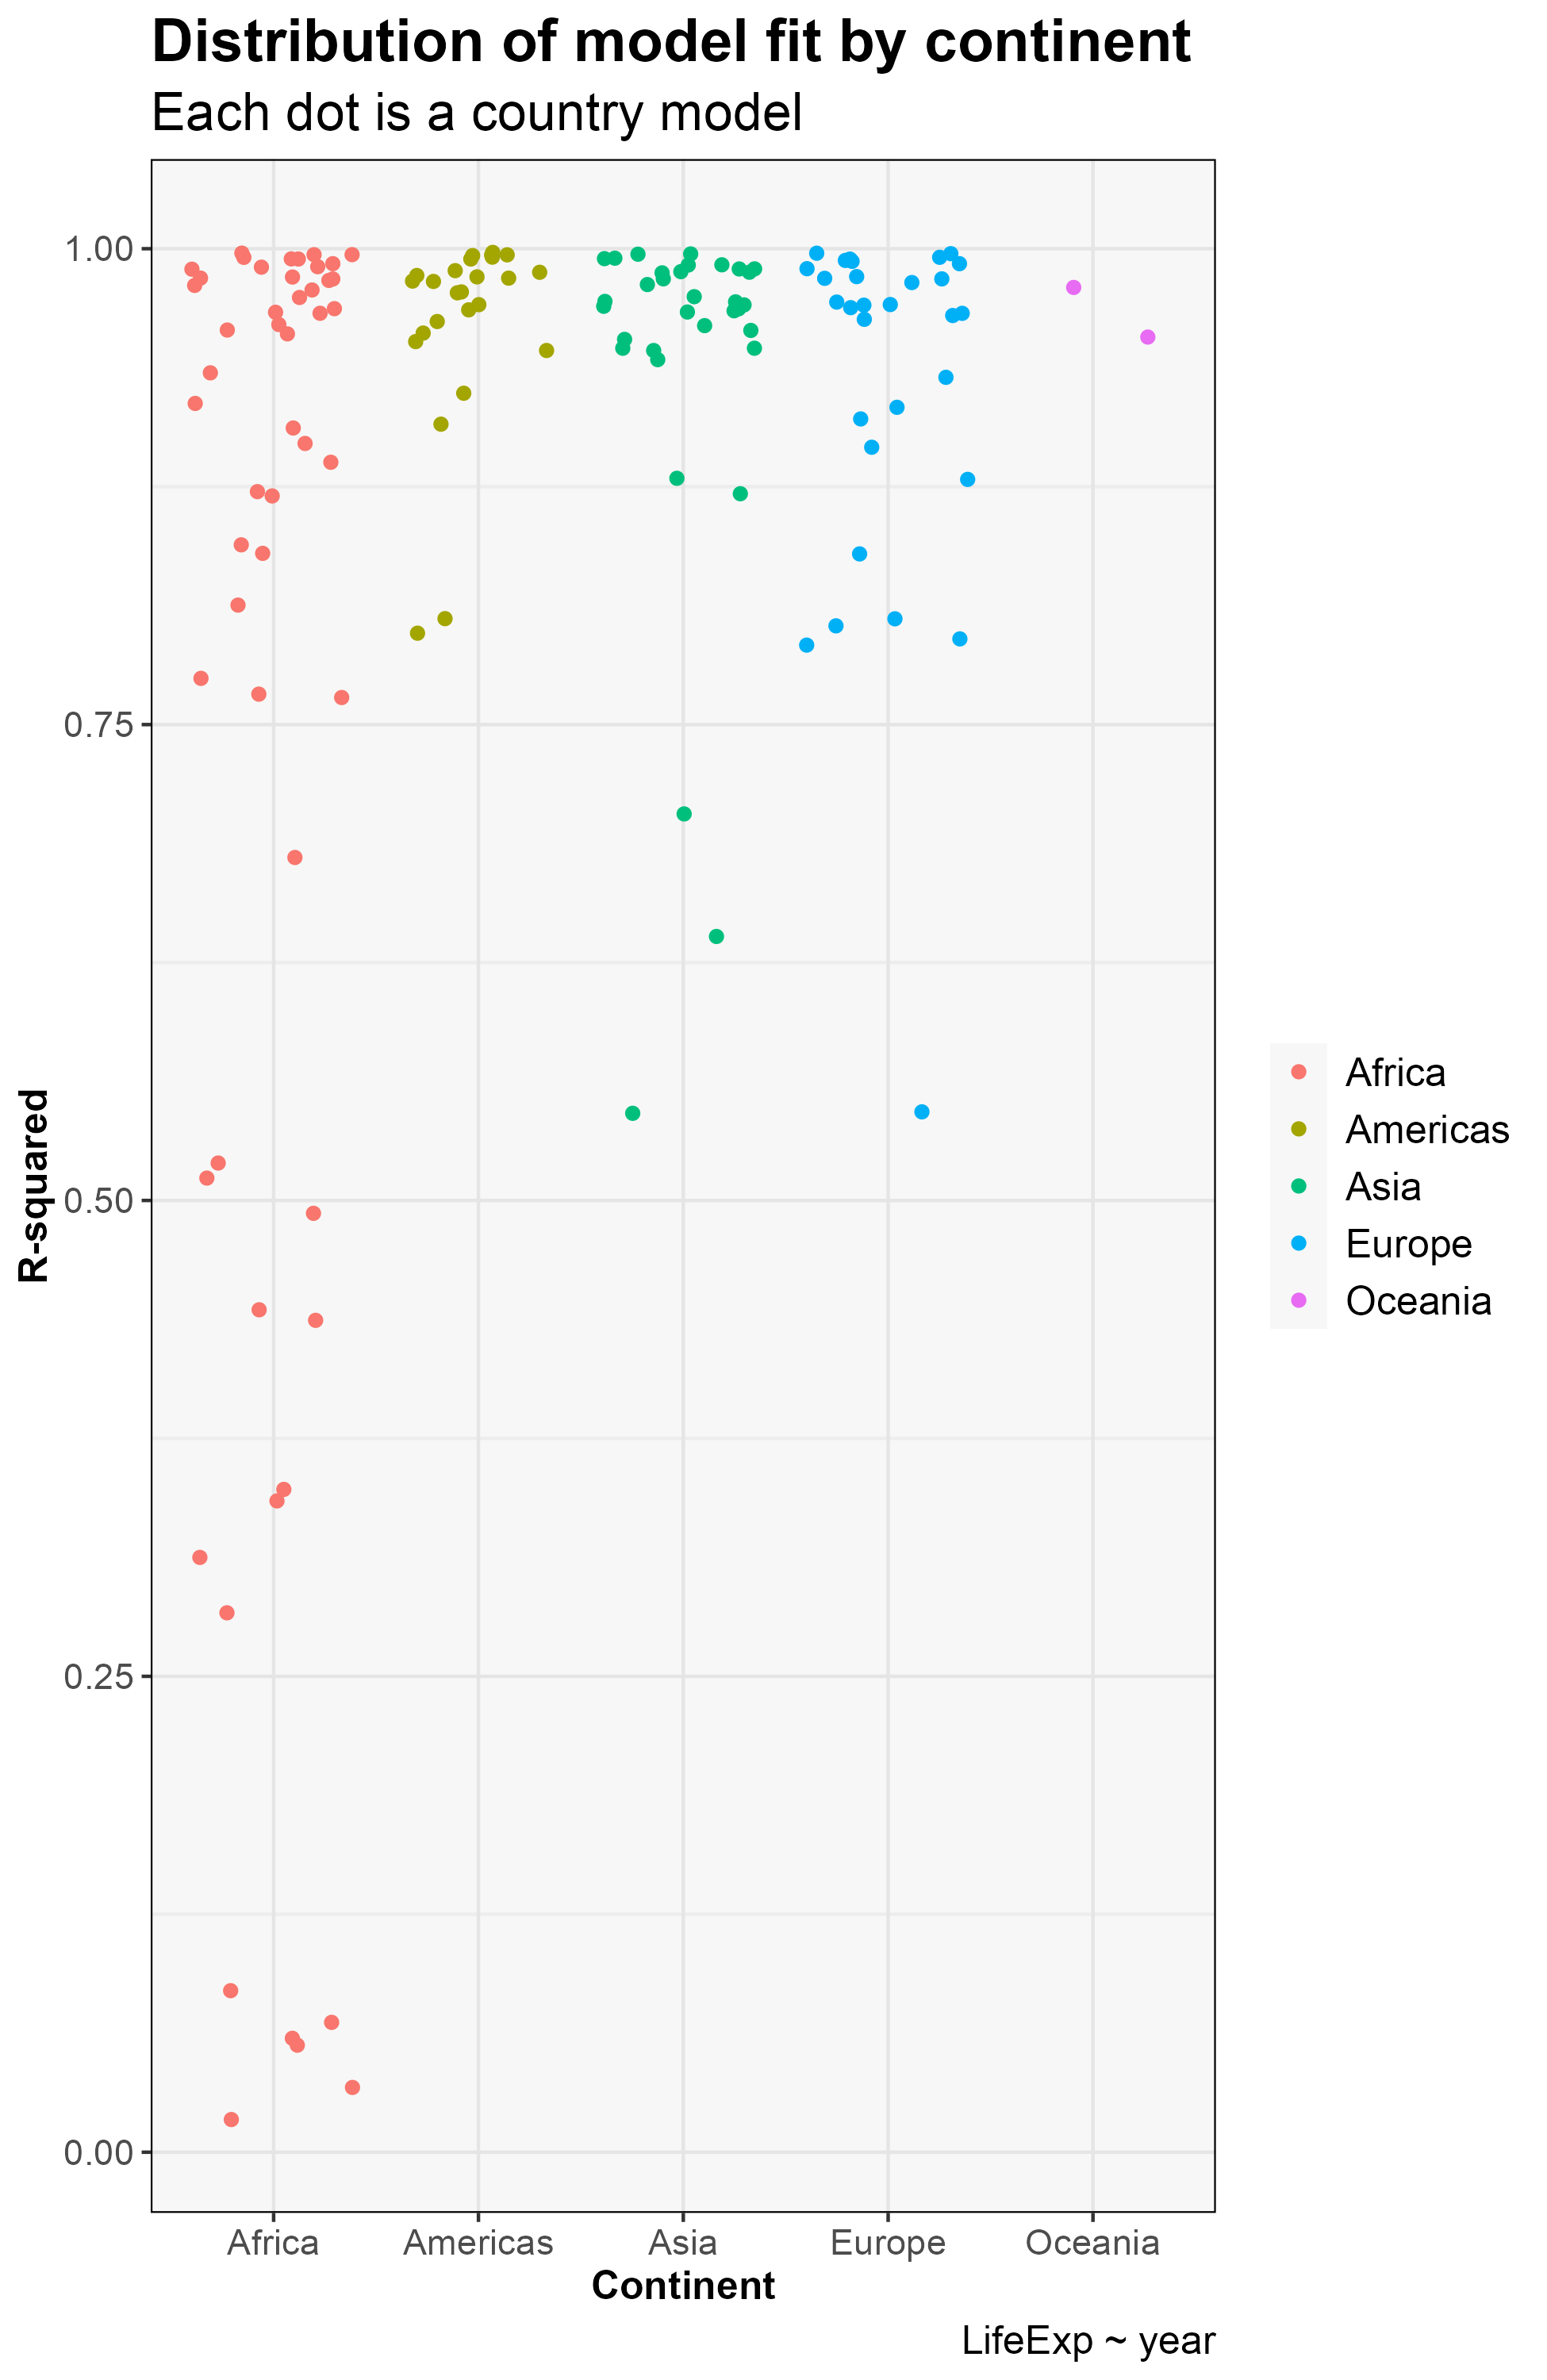
This post outlines the value in building nested models using the purrr and broom packages

Mickey Rafa
Oct 1, 2017
No matching items