Show code
if (!require("pacman")) install.packages("pacman")
pacman::p_load(
    tidyverse,
    tidytuesdayR,
    ggtext,
    showtext,
    janitor,   #for clean_names()
    scales,
    glue,
    here
)

font_add_google("Open Sans")September 22, 2020
if (!require("pacman")) install.packages("pacman")
pacman::p_load(
tidyverse,
tidytuesdayR,
ggtext,
showtext,
janitor, #for clean_names()
scales,
glue,
here
)
font_add_google("Open Sans")tt_year <- 2020
tt_week <- 39
tuesdata <- tidytuesdayR::tt_load(tt_year, week = tt_week)
peaks <- tuesdata$peaks
expeditions <- tuesdata$expeditionspeaks %>%
glimpse()Rows: 468
Columns: 8
$ peak_id <chr> "AMAD", "AMPG", "ANN1", "ANN2", "ANN3", "AN…
$ peak_name <chr> "Ama Dablam", "Amphu Gyabjen", "Annapurna I…
$ peak_alternative_name <chr> "Amai Dablang", NA, NA, NA, NA, NA, NA, NA,…
$ height_metres <dbl> 6814, 5630, 8091, 7937, 7555, 7525, 8026, 8…
$ climbing_status <chr> "Climbed", "Climbed", "Climbed", "Climbed",…
$ first_ascent_year <dbl> 1961, 1953, 1950, 1960, 1961, 1955, 1974, 1…
$ first_ascent_country <chr> "New Zealand, USA, UK", "UK", "France", "UK…
$ first_ascent_expedition_id <chr> "AMAD61101", "AMPG53101", "ANN150101", "ANN…expeditions %>%
glimpse()Rows: 10,364
Columns: 16
$ expedition_id <chr> "ANN260101", "ANN269301", "ANN273101", "ANN278301",…
$ peak_id <chr> "ANN2", "ANN2", "ANN2", "ANN2", "ANN2", "ANN2", "AN…
$ peak_name <chr> "Annapurna II", "Annapurna II", "Annapurna II", "An…
$ year <dbl> 1960, 1969, 1973, 1978, 1979, 1980, 1980, 1981, 198…
$ season <chr> "Spring", "Autumn", "Spring", "Autumn", "Autumn", "…
$ basecamp_date <date> 1960-03-15, 1969-09-25, 1973-03-16, 1978-09-08, NA…
$ highpoint_date <date> 1960-05-17, 1969-10-22, 1973-05-06, 1978-10-02, 19…
$ termination_date <date> NA, 1969-10-26, NA, 1978-10-05, 1979-10-20, 1980-0…
$ termination_reason <chr> "Success (main peak)", "Success (main peak)", "Succ…
$ highpoint_metres <dbl> 7937, 7937, 7937, 7000, 7160, 7000, 7250, 6400, 740…
$ members <dbl> 10, 10, 6, 2, 3, 6, 7, 19, 9, 5, 5, 5, 6, 4, 3, 4, …
$ member_deaths <dbl> 0, 0, 0, 0, 0, 1, 0, 0, 1, 0, 1, 0, 0, 0, 0, 0, 0, …
$ hired_staff <dbl> 9, 0, 8, 0, 0, 2, 2, 0, 3, 0, 0, 3, 4, 2, 0, 2, 5, …
$ hired_staff_deaths <dbl> 0, 0, 0, 0, 0, 0, 0, 0, 0, 0, 0, 0, 0, 0, 0, 0, 0, …
$ oxygen_used <lgl> TRUE, FALSE, FALSE, FALSE, FALSE, FALSE, FALSE, FAL…
$ trekking_agency <chr> NA, NA, NA, NA, NA, NA, NA, NA, NA, NA, NA, "Kunga"…expedition_attempts <- peaks %>%
select(peak_id, height_metres) %>%
left_join(x=.,
y=expeditions,
by='peak_id') %>%
mutate(basecamp_year = year(basecamp_date)) %>%
group_by(peak_name, basecamp_year) %>%
summarise(count_expeditions = n(),
.groups = 'drop') %>%
mutate(is_everest = if_else(peak_name == 'Everest',
'Everest', 'Other'))my_theme <- theme(
# choose font family
text = element_text(family = 'Open Sans', size=14),
axis.ticks = element_blank(),
plot.background = element_rect(fill = "white", colour = NA),
panel.background = element_rect(fill = "white", colour = NA),
legend.position = 'none',
panel.grid.major = element_blank(),
panel.grid.minor = element_blank(),
panel.border = element_blank())
arw <- arrow(length = unit(5, "pt"), type = "closed")peak_hist_viz <- peaks %>%
ggplot(.) +
geom_histogram(aes(x=height_metres),
fill='slategray3',
color='gray80',
bins=30) +
geom_curve(data = data.frame(),
aes(x = 8600, y = 9, xend = 8850, yend = 4),
color = 'black', arrow = arw) +
annotate("text", x=8600, y=11, label = 'Mt. Everest', family='Open Sans', size=7) +
ggtitle('Mount Everest is really tall',
subtitle = 'Distribution of peak heights in the Himalayas') +
labs(x='<br>Height (meters)',
y='Count',
caption='<br>Tidy Tuesday Week 39 (2020)<br>**Source**:The Himalayan Database') +
scale_x_continuous(labels = comma) +
my_theme +
theme(plot.title = element_textbox(size=rel(2.7), face='bold'),
plot.subtitle = element_text(size=rel(1.3)),
plot.caption = element_textbox(size=rel(1.1), lineheight = .3),
axis.title.y = element_textbox(hjust = 1, size=rel(1.3), face='bold'),
axis.title.x = element_textbox(size=rel(1.3), face='bold'),
axis.text = element_text(size=rel(1.4)))paving_everest_viz <- expedition_attempts %>%
ungroup() %>%
filter(complete.cases(.)) %>%
ggplot(.,
aes(x=basecamp_year,
y=count_expeditions,
color=is_everest,
size=is_everest)) +
geom_line(aes(group=peak_name)) +
geom_point(data=. %>% filter(basecamp_year == 2019,
peak_name == 'Everest')) +
annotate(geom = "text", x=2016, y=100,
label='Everest',
color='darkblue',
size=6,
fontface='bold') +
ggtitle('Paving Everest?',
subtitle = 'Tracking the increase in expeditions over time of Himalayan peaks') +
labs(x='Year (of basecamp)<br>',
y='Number of<br>expeditions',
caption='Tidy Tuesday Week 39 (2020)<br>**Source**:The Himalayan Database') +
scale_size_manual(values = c('Everest' = 1.2,
'Other' = .8)) +
scale_color_manual(values = c('Everest' = 'darkblue',
'Other' = 'gray60')) +
scale_y_continuous(position = 'right',
breaks = seq(0, 90, by=30),
labels = c('', '30', '60', '90')) +
my_theme +
theme(plot.title = element_textbox(size=rel(2.7), face='bold'),
plot.subtitle = element_text(size=rel(1.3)),
plot.caption = element_textbox(size=rel(1.1), lineheight = .3),
axis.title.y = element_textbox(size=rel(1.3), face='bold', lineheight = .3),
axis.title.x = element_textbox(size=rel(1.3), face='bold'),
axis.text = element_text(size=rel(1.4)))# Save the plot as PNG
ggsave(
filename = glue("tt_{tt_year}_{tt_week}_hist.png"),
plot = peak_hist_viz,
width = 10, height = 6.25, units = "in", dpi = 320
)
ggsave(
filename = glue("tt_{tt_year}_{tt_week}_line.png"),
plot = paving_everest_viz,
width = 10, height = 6.25, units = "in", dpi = 320
)
# make thumbnail for page
magick::image_read(glue("tt_{tt_year}_{tt_week}_hist.png")) %>%
magick::image_resize(geometry = "400") %>%
magick::image_write(glue("tt_{tt_year}_{tt_week}_hist_thumbnail.png"))
magick::image_read(glue("tt_{tt_year}_{tt_week}_line.png")) %>%
magick::image_resize(geometry = "400") %>%
magick::image_write(glue("tt_{tt_year}_{tt_week}_line_thumbnail.png"))R version 4.4.0 (2024-04-24)
Platform: aarch64-apple-darwin20
Running under: macOS Sonoma 14.6.1
Matrix products: default
BLAS: /Library/Frameworks/R.framework/Versions/4.4-arm64/Resources/lib/libRblas.0.dylib
LAPACK: /Library/Frameworks/R.framework/Versions/4.4-arm64/Resources/lib/libRlapack.dylib; LAPACK version 3.12.0
locale:
[1] en_US.UTF-8/en_US.UTF-8/en_US.UTF-8/C/en_US.UTF-8/en_US.UTF-8
time zone: America/Denver
tzcode source: internal
attached base packages:
[1] stats graphics grDevices utils datasets methods base
other attached packages:
[1] here_1.0.1 glue_1.8.0 scales_1.3.0 janitor_2.2.0
[5] showtext_0.9-7 showtextdb_3.0 sysfonts_0.8.9 ggtext_0.1.2
[9] tidytuesdayR_1.1.2 lubridate_1.9.3 forcats_1.0.0 stringr_1.5.1
[13] dplyr_1.1.4 purrr_1.0.2 readr_2.1.5 tidyr_1.3.1
[17] tibble_3.2.1 ggplot2_3.5.1 tidyverse_2.0.0 pacman_0.5.1
loaded via a namespace (and not attached):
[1] gtable_0.3.5 xfun_0.48 httr2_1.0.5 htmlwidgets_1.6.4
[5] gh_1.4.1 tzdb_0.4.0 vctrs_0.6.5 tools_4.4.0
[9] generics_0.1.3 curl_5.2.3 parallel_4.4.0 fansi_1.0.6
[13] pkgconfig_2.0.3 lifecycle_1.0.4 farver_2.1.2 compiler_4.4.0
[17] textshaping_0.4.0 munsell_0.5.1 snakecase_0.11.1 htmltools_0.5.8.1
[21] yaml_2.3.10 pillar_1.9.0 crayon_1.5.3 magick_2.8.5
[25] commonmark_1.9.2 tidyselect_1.2.1 digest_0.6.37 stringi_1.8.4
[29] labeling_0.4.3 rprojroot_2.0.4 fastmap_1.2.0 grid_4.4.0
[33] colorspace_2.1-1 cli_3.6.3 magrittr_2.0.3 utf8_1.2.4
[37] withr_3.0.1 rappdirs_0.3.3 bit64_4.5.2 timechange_0.3.0
[41] rmarkdown_2.28 gitcreds_0.1.2 bit_4.5.0 ragg_1.3.3
[45] hms_1.1.3 evaluate_1.0.1 knitr_1.48 markdown_1.13
[49] rlang_1.1.4 gridtext_0.1.5 Rcpp_1.0.13 xml2_1.3.6
[53] rstudioapi_0.17.1 vroom_1.6.5 jsonlite_1.8.9 R6_2.5.1
[57] systemfonts_1.1.0---
title: "Visualizing the Himalayas and expeditions over time"
description: "Using data from the Himalayan Database to put the scope and expedition activity into perspective"
author:
- name: Mickey Rafa
url: https://mrafa3.github.io/
date: 09-22-2020
categories: [R, "#TidyTuesday", histogram, line-plot] # self-defined categories
image: "tt_2020_39_hist_thumbnail.png"
draft: false # setting this to `true` will prevent your post from appearing on your listing page until you're ready!
format:
html:
toc: true
toc-depth: 5
code-link: true
code-fold: true
code-tools: true
code-summary: "Show code"
self-contained: true
editor_options:
chunk_output_type: inline
execute:
error: false
message: false
warning: false
eval: true
---
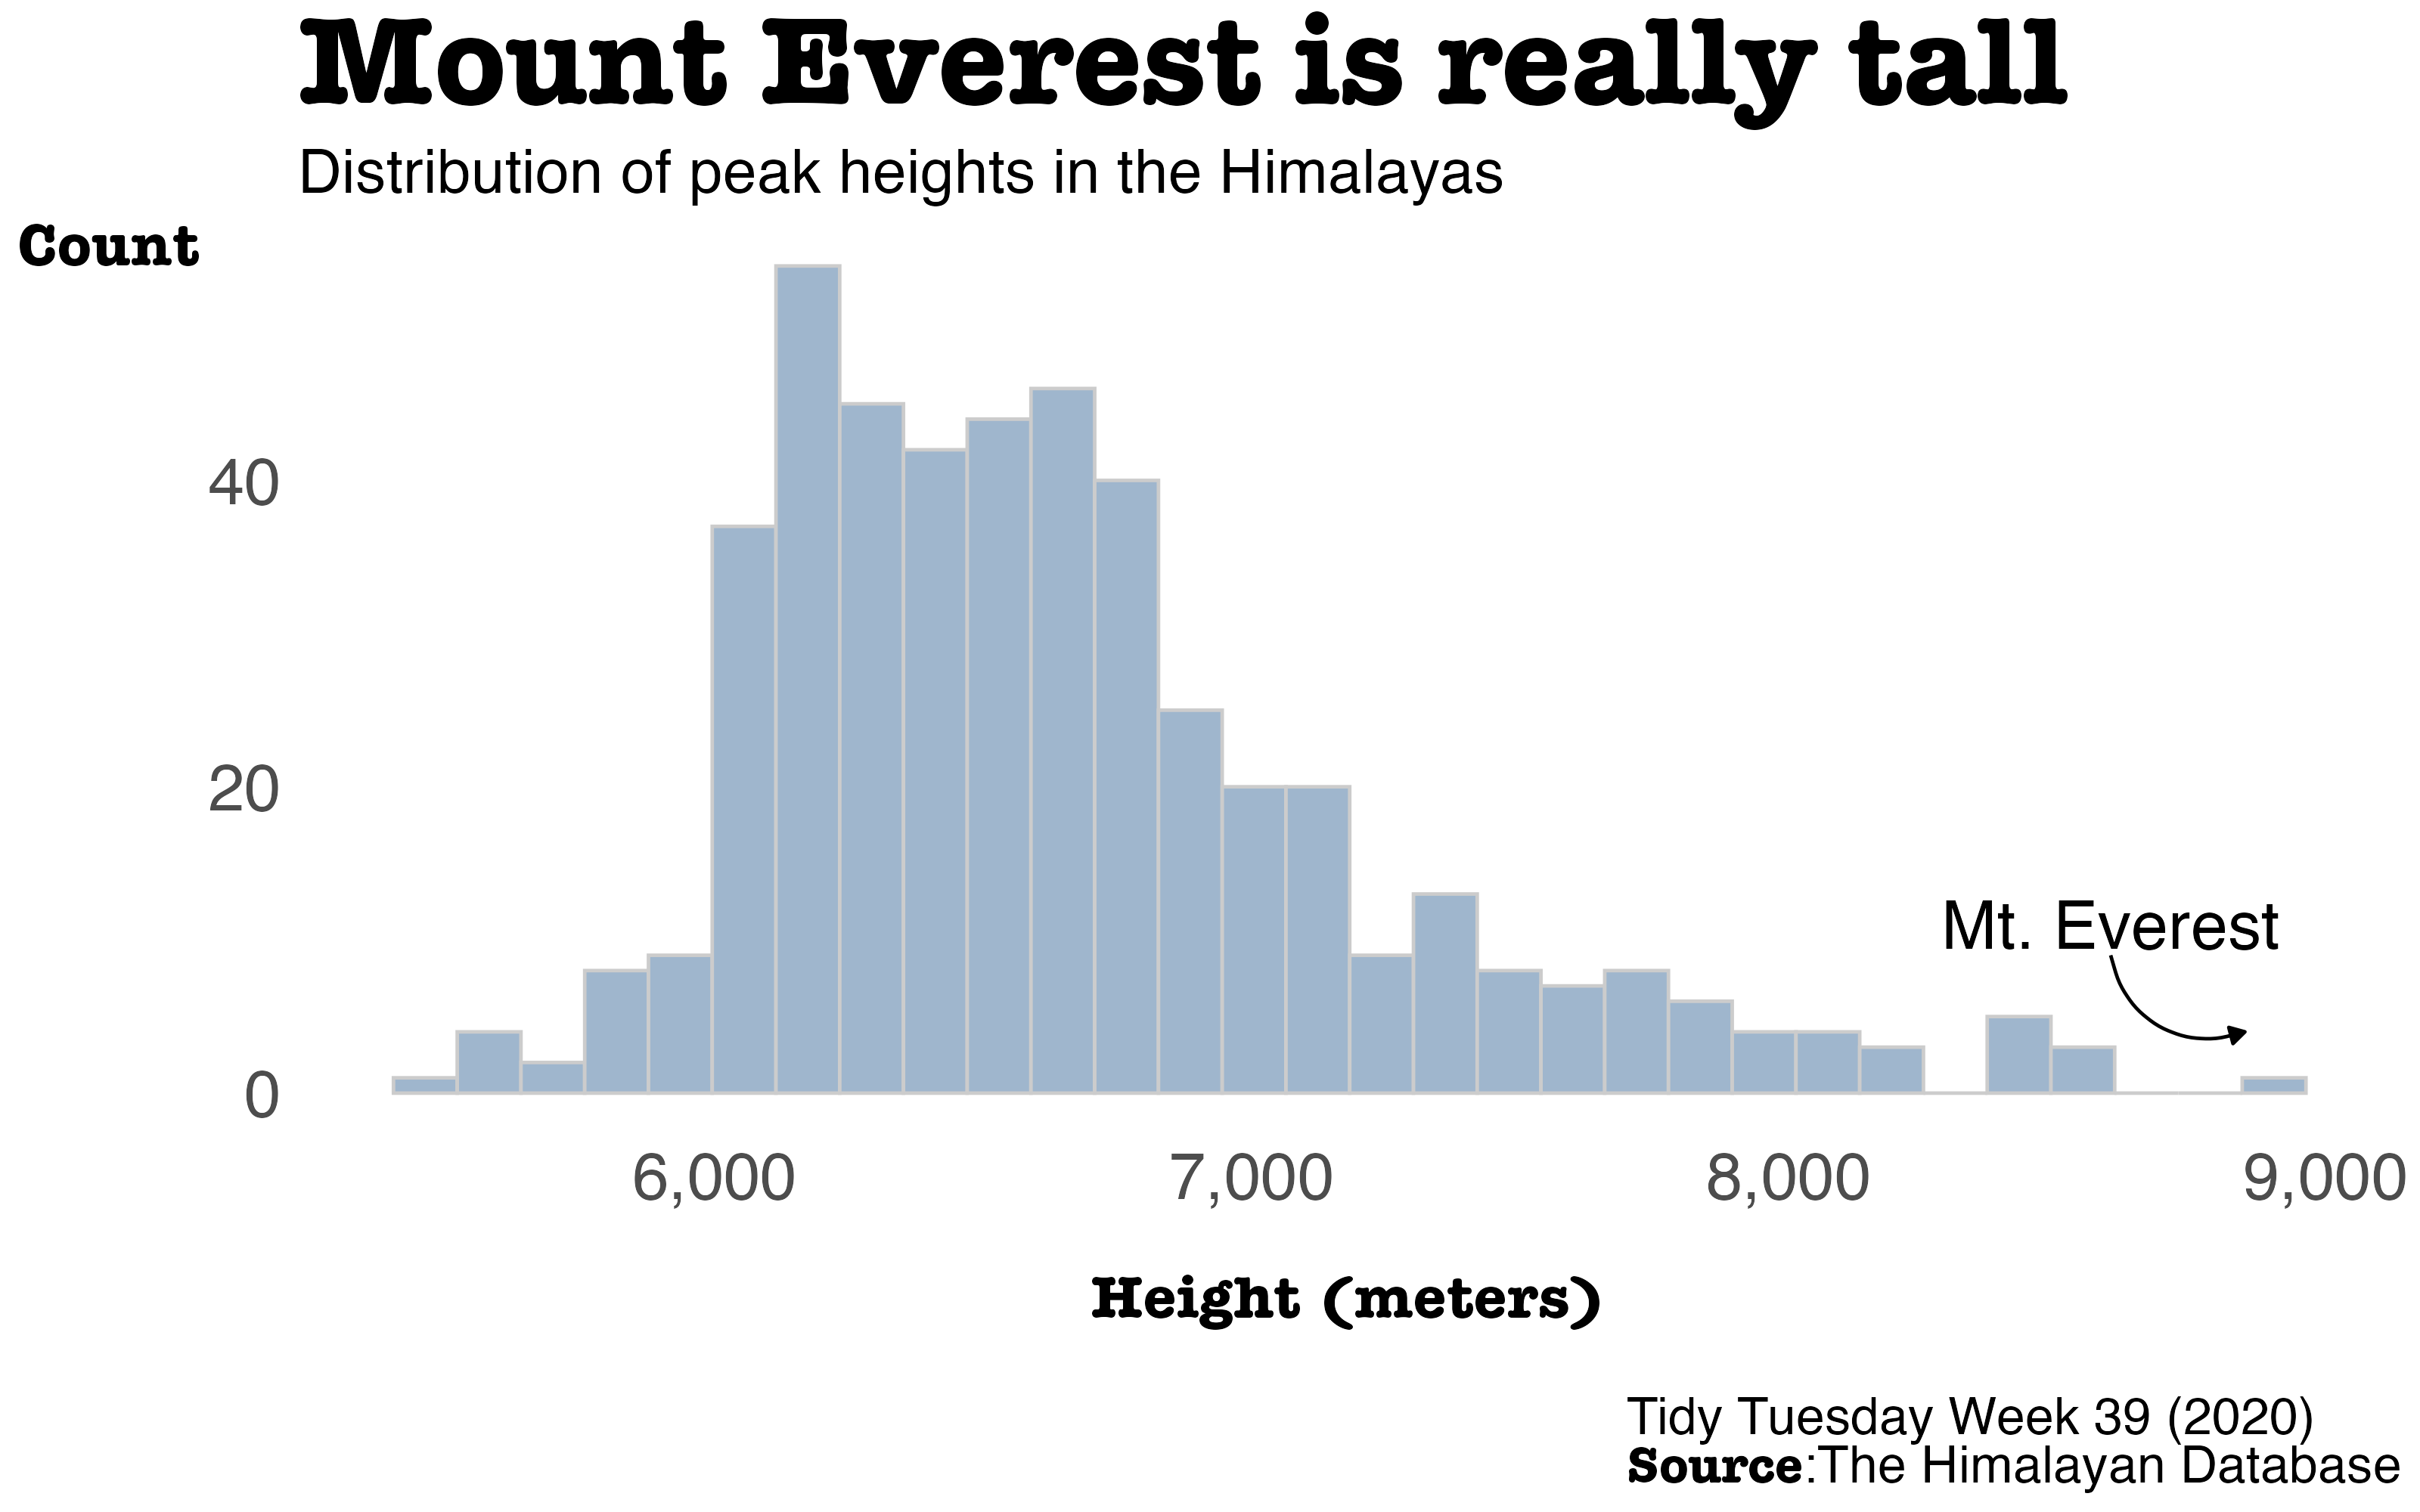
{#fig-1}
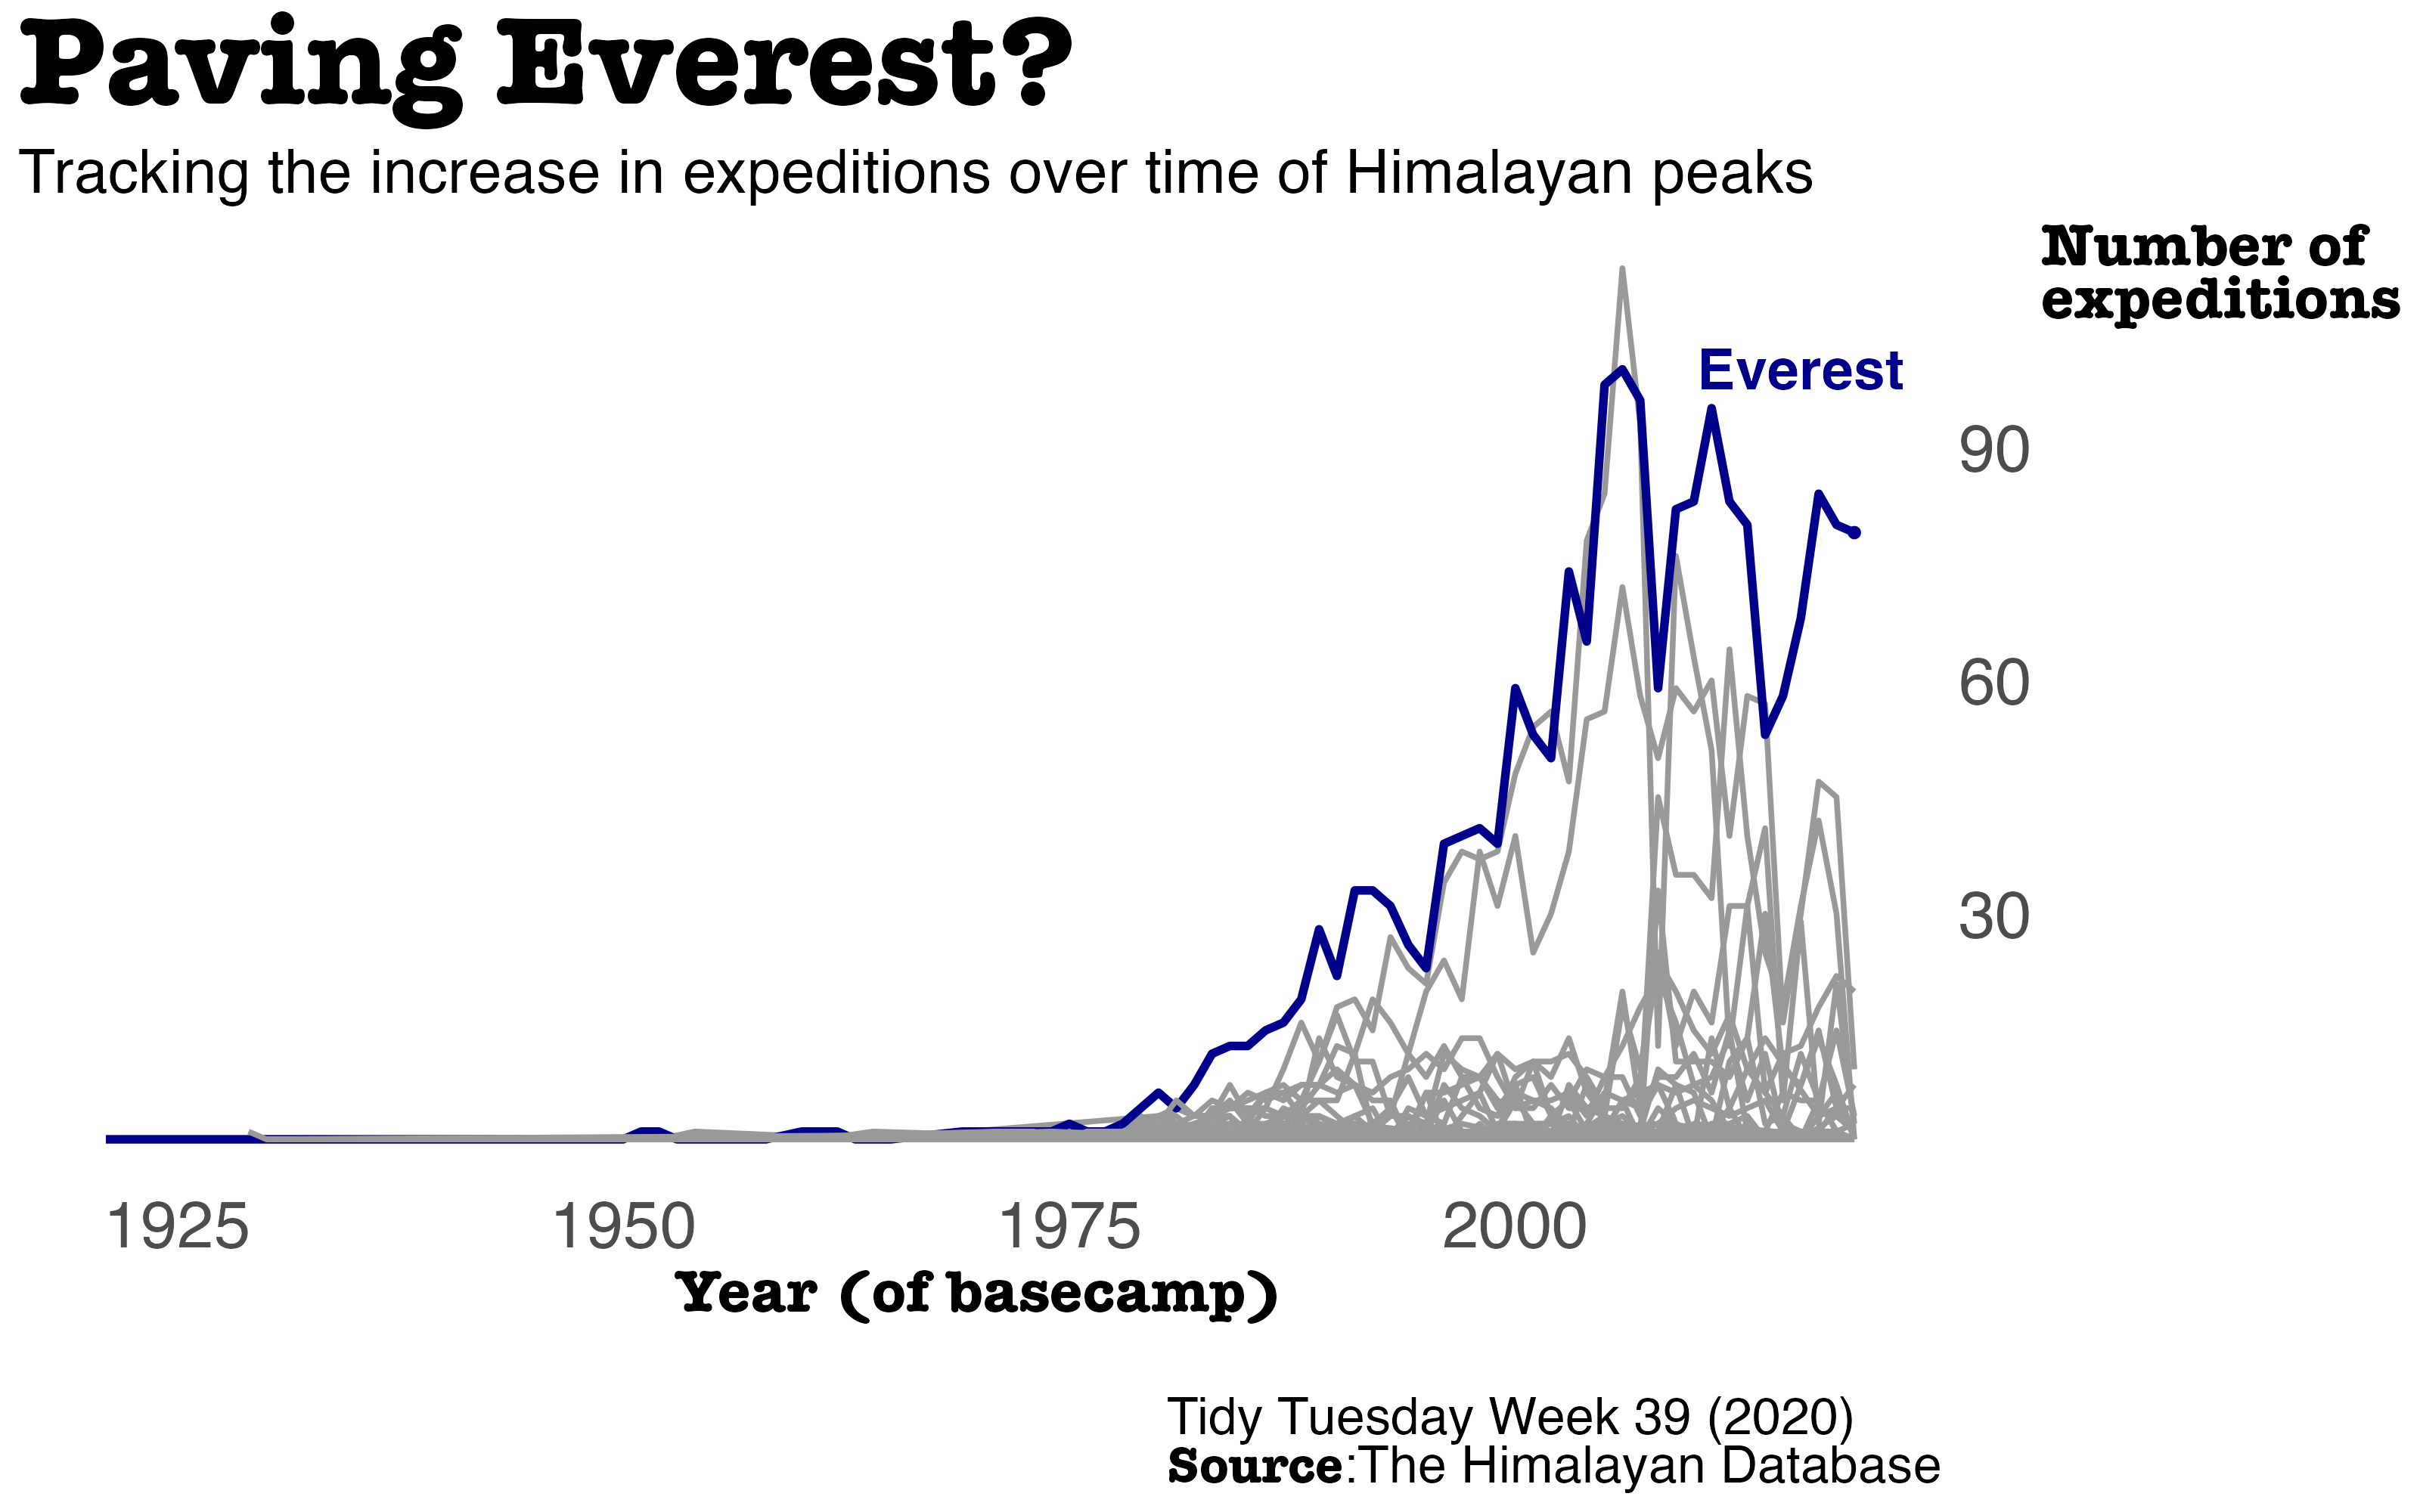
{#fig-2}
# 1. Load Packages & Setup
```{r setup, include=TRUE}
if (!require("pacman")) install.packages("pacman")
pacman::p_load(
tidyverse,
tidytuesdayR,
ggtext,
showtext,
janitor, #for clean_names()
scales,
glue,
here
)
font_add_google("Open Sans")
```
# 2. Read in the Data
```{r read_data, include=TRUE}
tt_year <- 2020
tt_week <- 39

tuesdata <- tidytuesdayR::tt_load(tt_year, week = tt_week)

peaks <- tuesdata$peaks
expeditions <- tuesdata$expeditions
```
# 3. Examine the Data
```{r examine, include=TRUE, echo=TRUE}
peaks %>%
  glimpse()
expeditions %>%
  glimpse()
```
# 4. Tidy the Data
```{r tidy_expedition, include=TRUE}
expedition_attempts <- peaks %>%
  select(peak_id, height_metres) %>%
  left_join(x=.,
            y=expeditions,
            by='peak_id') %>%
  mutate(basecamp_year = year(basecamp_date)) %>%
  group_by(peak_name, basecamp_year) %>%
  summarise(count_expeditions = n(),
            .groups = 'drop') %>%
  mutate(is_everest = if_else(peak_name == 'Everest',
                              'Everest', 'Other'))
```
# 5. Visualization Parameters
```{r my_theme, include=TRUE}
my_theme <- theme(
  # choose font family
  text = element_text(family = 'Open Sans', size=14),
  axis.ticks = element_blank(),
  plot.background = element_rect(fill = "white", colour = NA),
  panel.background =  element_rect(fill = "white", colour = NA),
  legend.position = 'none',
  panel.grid.major = element_blank(),
  panel.grid.minor = element_blank(),
  panel.border = element_blank())

arw <- arrow(length = unit(5, "pt"), type = "closed")
```
# 6. Plot
#### Histogram
```{r height_meters_hist, include=TRUE, fig.height=6.25, fig.width=10}
peak_hist_viz <- peaks %>%
  ggplot(.) +
  geom_histogram(aes(x=height_metres),
                 fill='slategray3',
                 color='gray80',
                 bins=30) +
  geom_curve(data = data.frame(),
             aes(x = 8600, y = 9, xend = 8850, yend = 4),
             color = 'black', arrow = arw) +
  annotate("text", x=8600, y=11, label = 'Mt. Everest', family='Open Sans', size=7) +
  ggtitle('Mount Everest is really tall',
          subtitle = 'Distribution of peak heights in the Himalayas') +
  labs(x='<br>Height (meters)',
       y='Count',
       caption='<br>Tidy Tuesday Week 39 (2020)<br>**Source**:The Himalayan Database') +
  scale_x_continuous(labels = comma) +
  my_theme +
  theme(plot.title = element_textbox(size=rel(2.7), face='bold'),
        plot.subtitle = element_text(size=rel(1.3)),
        plot.caption = element_textbox(size=rel(1.1), lineheight = .3),
        axis.title.y = element_textbox(hjust = 1, size=rel(1.3), face='bold'),
        axis.title.x = element_textbox(size=rel(1.3), face='bold'),
        axis.text = element_text(size=rel(1.4)))
```
#### Line plot
```{r paving_everest_viz, include=TRUE, fig.height=6.25, fig.width=10}
paving_everest_viz <- expedition_attempts %>%
  ungroup() %>%
  filter(complete.cases(.)) %>%
  ggplot(.,
         aes(x=basecamp_year,
             y=count_expeditions,
             color=is_everest,
             size=is_everest)) +
  geom_line(aes(group=peak_name)) +
  geom_point(data=. %>% filter(basecamp_year == 2019,
                               peak_name == 'Everest')) +
  annotate(geom = "text", x=2016, y=100,
           label='Everest',
           color='darkblue',
           size=6,
           fontface='bold') +
  ggtitle('Paving Everest?',
          subtitle = 'Tracking the increase in expeditions over time of Himalayan peaks') +
  labs(x='Year (of basecamp)<br>',
       y='Number of<br>expeditions',
       caption='Tidy Tuesday Week 39 (2020)<br>**Source**:The Himalayan Database') +
  scale_size_manual(values = c('Everest' = 1.2,
                               'Other' = .8)) +
  scale_color_manual(values = c('Everest' = 'darkblue',
                                'Other' = 'gray60')) +
  scale_y_continuous(position = 'right',
                     breaks = seq(0, 90, by=30),
                     labels = c('', '30', '60', '90')) +
  my_theme +
  theme(plot.title = element_textbox(size=rel(2.7), face='bold'),
        plot.subtitle = element_text(size=rel(1.3)),
        plot.caption = element_textbox(size=rel(1.1), lineheight = .3),
        axis.title.y = element_textbox(size=rel(1.3), face='bold', lineheight = .3),
        axis.title.x = element_textbox(size=rel(1.3), face='bold'),
        axis.text = element_text(size=rel(1.4)))
```
# 7. Save
```{r save_plot, include=TRUE}
# Save the plot as PNG
ggsave(
  filename = glue("tt_{tt_year}_{tt_week}_hist.png"),
  plot = peak_hist_viz,
  width = 10, height = 6.25, units = "in", dpi = 320
)

ggsave(
  filename = glue("tt_{tt_year}_{tt_week}_line.png"),
  plot = paving_everest_viz,
  width = 10, height = 6.25, units = "in", dpi = 320
)

# make thumbnail for page
magick::image_read(glue("tt_{tt_year}_{tt_week}_hist.png")) %>%
  magick::image_resize(geometry = "400") %>%
  magick::image_write(glue("tt_{tt_year}_{tt_week}_hist_thumbnail.png"))

magick::image_read(glue("tt_{tt_year}_{tt_week}_line.png")) %>%
  magick::image_resize(geometry = "400") %>%
  magick::image_write(glue("tt_{tt_year}_{tt_week}_line_thumbnail.png"))
```
# 8. Session Info
::: {.callout-tip collapse="true"}
##### Expand for Session Info
```{r, echo = FALSE}
sessionInfo()
```
:::
# 9. Github Repository
::: {.callout-tip collapse="true"}
##### Expand for GitHub Repo
[Access the GitHub repository here](https://github.com/mrafa3/mrafa3.github.io)
:::